Don’t miss an episode of our podcast, Personal Finance for Long-Term Investors. Available on all podcast players.
Here’s the latest episode:
Today we’re going to take a look at the well-known Trinity Study. For those who aren’t familiar, don’t worry. I will start by explaining what the Trinity Study is, how it was done, and how to use its results. The Trinity Study is all about saving and planning for retirement.
PS: Here’s a straightforward financial independence and 4% rule calculator where you can input your own data.
But then I’m going to take a look at a few possible visions of the future. We will create an updated Trinity Study to use as part of our retirement planning. We’ll see how the Trinity Study birthed the famous “4% rule” (and you can read here how most DIY investors use the 4% rule completely incorrectly).
I’m also going to introduce an interesting risk-mitigation tactic. It’s called consumption smoothing. Bears do it, trees do it, and it feels like it should work for retirees. But we’ll see why Mother Nature’s tactics fail in retirement planning.

The What: Describing the Original Trinity Study
If you’re already intimately familiar with the Trinity Study, please skip to the Wade Pfau section of the article. Right now, we’ll introduce the original Trinity Study.
The Trinity Study was a retirement planning study published in the February 1998 issue of AAII by three professors at Trinity College, in Texas. They based their work on William Bengen’s SAFEMAX study (1994).
The goal of the Trinity Study was to determine a safe withdrawal rate (SWR) for retirement accounts. A withdrawal rate is the “salary” that you pay yourself during retirement by withdrawing money from your retirement nest egg—investments like mutual funds, taxable accounts, tax-deferred 401k, tax-advantaged Roth IRA, annuities, defined benefit pensions, etc. (Social Security income is not part of the Trinity Study).

A safe withdrawal rate is a withdrawal rate that allows a retiree to not run out of money by the time they die. SWR can also be thought of as a portfolio success rate. What’s a sustainable withdrawal rate and asset allocation that leads to retirement success?
Running out of money would be bad; not safe for one’s retirement plans! The Trinity Study aimed to provide a reliable SWR so that retirees would know how at-risk they were to run out of funds.
People in the FIRE movement frequently reference the Trinity Study when planning early retirement withdrawals. If you Google “4% Rule” or “retire with 25x your annual spending,” you’ll see what I mean. Many FIREees directly tie their Savings Rates to the Trinity Study so they can figure out when it’s safe for them to retire.
Study Assumptions, Method, and Outcome
Let’s dig into the specifics of the Trinity Study. It has more nuance than most people in the FIRE community know.
Asset Allocations
The study assumed that most retirees’ portfolios can be categorized based on their stock and bond allocations. The study looked at portfolio that were 100% stocks + 0% bonds, 75% stocks + 25% bonds, 50/50, 25/75, and 0/100.
That’s fair. Most retirees’ portfolios contain a mix of stocks and bonds.
Both the Trinity Study and Bengen’s original research incorporated long-term, high-grade corporate bonds. Corporate bond returns are typically higher-but-riskier than government bonds (note: as of January 2024, 10-year treasury bonds are yielding ~4.0%. In 1995, they were yielding 7.9%).
The stocks in the portfolios were assumed to be a diverse mix of stocks from developed market countries i.e. a portfolio with returns using historical data. For example, a Vanguard or Fidelity total market index fund.
Summary: the Trinity study examined many mixes of stocks and bonds.
Retirement Duration
The study also looked at various lengths of retirement. Some people will retire at 50 and live until 90—a 40-year retirement. Other people retire at 65 and live until 80—a 15-year retirement.
A short retirement might succeed even if the retiree withdraws a high percentage of their nest egg every year. A long retirement, on the other hand, might fail even if the retiree withdraws a lower percentage of their nest egg every year.

Different Withdrawal Rates
The study authors varied their withdrawal rate from 3% to 10% per year.
A 3% withdrawal rate is likely to be more successful—you’re spending less money every year and allowing more of your money to remain in your portfolio to (ideally) grow. However, a low withdrawal rate also leads to a more restricted retirement lifestyle.
A 10% withdrawal rate is opulent but more likely to fail. An unfortunate side effect of spending more money is that you’ll quickly run out.
The question, then, is, “How do we find the highest withdrawal rate possible while not running out of money?”
Heart of the Trinity Study
The real heart of the study—the question being asked and answered—is:
“If a person retired in Year A, stayed retired for B years, and withdrew C% of their portfolio each year, will they run out of money using a D ratio portfolio of stocks and bonds?”
The researchers asked this critical question for every single combination of
- Year A (from 1926 through 1995)
- B years of retirement (from 15 to 40, in multiples of 5)
- C% of annual withdrawal (from 3% up to 10%)
- and D ratio of stocks and bonds
Ostensibly, a retirement that is too long, suffers through a bad market, or withdraws too much money each year could run out of money. That retirement could fail.
The various scenarios are tested using historical market data from 1926 to 1995. For example, when B = 30 years, the authors tested all 30-year rolling periods from 1926 to 1995.

The Creation of the 4% Rule
While there are many valuable outcomes from the Trinity Study, the main result has been nicknamed the “4% Rule.” The highlights of the 4% Rule are:
- If you use a 4% as Year 1 initial withdrawal, slowly increasing it each year to adjust for inflation… (Study input C)
- In a 50/50 stock/bond portfolio… (Input D)
- For a 30-year retirement… (Input B)
- Then you would have been “safe” for 95% of starting years in the study (Input A)
So this would suggest that a retiree with $1 million dollars could reasonably expect to withdraw $40,000 (which is 4% of $1 million) in their first year and afterward increase for inflation each year**.
This would have allowed that retiree to successfully live a 30-year retirement without running out of money in 95% of the rolling 30-year periods that the study looked at.
**Note: increasing for inflation is the most-often overlooked aspect of the 4% Rule.
“4%” applies to Year 1 of your retirement. Each subsequent year’s withdrawal assumes you’ve adjusted that number up by the rate of inflation.
Here’s that 4% rule & FIRE calculator again, if you want to check it out.
Enjoying this article? Subscribe below to get new articles emailed straight to your inbox
The Wade Pfau Updated Trinity Study
Wade Pfau is a professor and PhD in Financial Planning. He’s written excellent pieces on the Trinity Study, including an updated Trinity Study using data through 2014.
Along with the extended data set, Pfau also changed the type of bond the study assumed. The original study used corporate bonds, but Pfau thought looking at intermediate-term government bonds was wiser.
With this change, Pfau’s outcomes look more optimistic than the original study. Pfau found a 100% chance of success (instead of 95%) using the same assumptions that created the original 4% Rule. In Pfau’s update, every 30-year retiree still had money using a 50/50 stock/bond portfolio and withdrawing 4% (plus annual inflation) of their retirement savings each year. This is good news!
But Pfau also asks and examines a crucial question in his updated Trinity Study: will the future look like the past?

Will the Future Look Like the Past?
To call this a “million-dollar question” would be an understatement. It’s a trillion-dollar question!
The Trinity Studies are based on historical market data. That data was taken from a period of fantastic American growth. In the past 100 years, our society has taken unprecedented leaps in manufacturing, technology, and information. Is it wise to assume that the future will look like the past? Will growth continue to be as positive? Should we continue to invest at all-time highs?
The contrarian might point out that the Trinity periods also included the Great Depression, Stagflation in the 70’s, the Dot Com bubble and the 2008 subprime crisis. So, there are some terrible times in there too.
Should We Examine Through Rose-Tinted Glasses, Though?
What will our retirements look like if we achieve global peace, boundless wealth for daily lattes and avocado toast, and we add 4 hours of extra daylight to pursue our passions?
Is that a question worth answering? No! For many reasons, including that, we don’t need to be worried about utopia. They say, “Hope for the best, but plan for the worst.” That’s what we want to do here. We want to plan on things being tough.
We might have to choose lower withdrawal rates. If we’re right, we’ll be thankful we planned for it. But if we’re wrong and things are great…well, great! If I’m wrong, I’ll accept “things are great” as a consolation prize.
The Best Interest Updated Trinity Study Simulation
Riffing off of Wade Pfau, I’m unofficially adding to the Trinity Study to look at possible bleak futures.
Assumptions
To create my version of the updated Trinity Study, I ran Monte Carlo simulations.
I created an alternate reality, used randomness to determine the nature and volatility of that reality, and then figured out how a retiree would fare in that reality. Then I repeated that random reality a few million times for different market returns, SWRs, etc.
Some assumptions in my analysis:
- I looked at average annual market returns varying from 3% to 7%, calculated on a monthly basis. People often cite the S&P 500 having 9%-10% returns. A balanced, lower-risk portfolio might have 6%-7% returns. But remember, we’re looking at worse markets than the past.
- Assumed that monthly portfolio returns have a standard deviation of 3%, due to mix of stocks and bonds. This is based off of historical variations from Burton Malkiel’s data sets.
- Used a Laplace distribution to determine the “randomness” in the simulation.
- Only looked at 30-year retirements, to keep in line with the oft-quoted result from the original Trinity Study (the 4 percent rule is based on 30-year retirement).
- Chose various withdrawal rates using the original study as a guide
- Assumed our investor only withdraws their money once per year. E.g. they withdraw $40K on January 1st, and live off that $40K until the following January 1st, etc.
- Assumed an annual 3% inflation to calculate the inflation-adjusted withdrawal rate
- (For second analysis only) Assumed a 0.5% return on cash (e.g., a high-yield savings account).
Keep in mind, this took me a few hours to set up and get results. The actual Trinity authors are career academics and ran their studies like professionals. I admit that my assumptions and methodology are not as rigorous as theirs. But I think we can glean some insightful information nonetheless.

On Pessimism:
A lot of people felt that my original analysis was too pessimistic. So pessimistic, in fact, that it lost integrity. That it’s worse than the worst-case scenario.
So, I want to emphasize: I’m only asking What if? there’s a terrible, bleak future. How might someone conservatively alter their retirement goals? How might someone’s current savings plan and savings rate be affected? Is it worth re-checking the retirement calculator?
I, like you, hope the future is as good or better than the past. So I don’t want anyone to start stockpiling precious metals because of my fictional simulation.
In the post-coronavirus investing world of zero percent interest rates, is it so crazy to think that the next few decades might behave differently than the past?
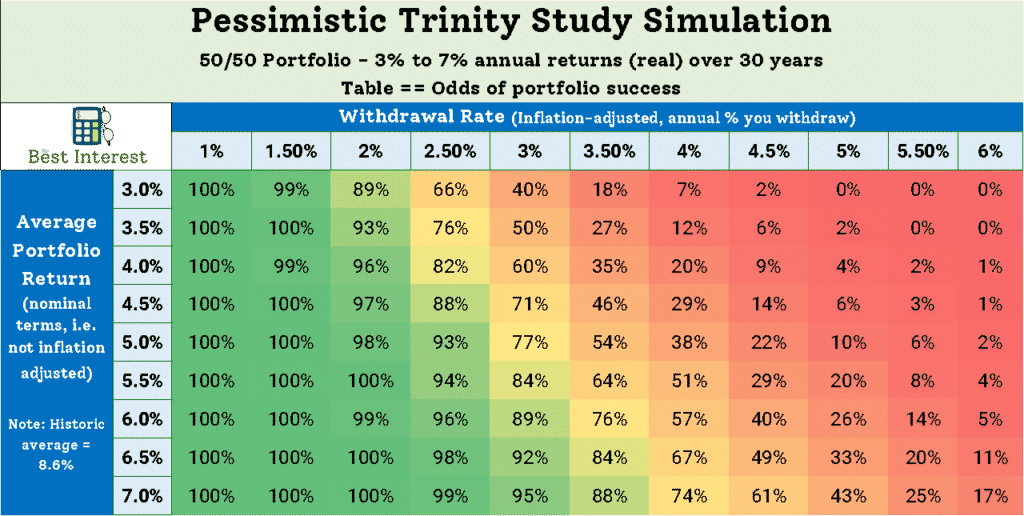
Results
Below is the summary table of results from my random simulations.
The SWR varies by column, and the average annual return varies by row.
The actual entries in the table are the percentage of simulations that created a successful retirement based on a particular combination of SWR and market return.

What sticks out? Where do we start?
To me, I immediately take a look at the 4% SWR column, because that’s what the Trinity Study has convinced us is safe.
If the Market Stagnates Long-term, Then the 4% Rule is in Trouble.
Thankfully, Microsoft Excel has some cool color schemes to help us with the visualization.
If traditional 50/50 portfolios underperform compared to historical precedent, then the 4% rule is in trouble. This isn’t shocking.
If we want to achieve the “security” that the tradition 4% Rule provides, we have to look for a ~95% chance of success. Moving to a 3% or 3.5% Rule immediately provides that safety margin (even in some terrible markets). But, of course, moving to a lower withdrawal rate means that we have to save more money in order to maintain the same standard of living.
A few question, though, immediately arise.
First, what are the good reasons to expect this underperformance? Have we ever seen a period perform this poorly?
And second, can we do anything about it?
On the first question: yes, we have seen 50/50 portfolios perform as poorly as 6.17% per year for a full 30-year period.
With government bond rates at historic lows and the stock market at historic highs, there are legitimate concerns over future returns. The optmistic news: average 50/50 portfolio performance is 8.6% per year.
Can we do anything about it?
Consumption Smoothing
One idea that neither the original Trinity Study nor Pfau’s update looked at was the idea of consumption smoothing. In brief, consumption smoothing means “do more when times are good, do less when times are bad.”
To explain more, let’s think about a tree.

Here in chilly Rochester, NY (and other non-equatorial climes) trees only have leaves during the late spring, summer, and early autumn. During the long summer days, the trees absorb as much solar energy as they can.
But during the winter months, days get short. It doesn’t make sense for the tree to maintain its leaves—which consume resources—for such a short day. Therefore, the tree drops its leaves in the autumn and survives off the previous summer’s gathered energy.
Put another way: the tree uses surplus energy gathered during the bountiful summer in order to survive the harsh winter.
For our purposes, consumption smoothing means “withdraw more money when the market is up, and withdraw less when the market is down.”
You know that phrase Buy low, Sell high? Well, consumption smoothing helps you emphasize the Sell high part by withdrawing more money when the market is high. It also prevents you from Selling Low too much, by withdrawing less when the markets are down. You use your extra Sell High money to “smooth out” the bad years that may come later.
Simulation with Consumption Smoothing
So I ran the simulation again, this time using a consumption smoothing algorithm. What did this algorithm look like?
In short, I created a “Cash Reserve” in the simulation, which started at $0. After each year that the market went up, I would pull that both that year’s withdrawal (the SWR amount) and extra money to go into the Cash Reserve. But if the market went down, I used a combination of the previous years’ Cash Reserve and retirement withdrawal to fulfill that year’s spending need.

It’s just like my tree. During good years, we’re the tree in summer. We’re withdrawing money for this year, and money for a time when we’ll need it in the future. During bad years, we’re the tree in winter. We]re borrowing from the good years’ reserve before tapping into our retirement account.
Consumption Smoothing Results
The results might surprise you. It feels like we’re being cautious. We’re “gettin’ while the gettin’ is good.” But what works for bears and trees does not work for retirees.
This is the same exact simulation as before, except with consumption smoothing turned on. Our portfolio failure rate increases slightly across the board. But why?!
The answer is simple: pulling out extra cash—even during “high” markets—will stifle your long-term portfolio growth. Money left alone in your portfolio will continue to grow. Money that you pull out will cease to grow. Consumption smoothing stifles long-term growth.
Remember John Bogle’s advice:
Don’t do something. Just stand there.
John Bogle
Living beings are trained for action. Trees need to gather sunlight. Humans reward hard work. A bear who doesn’t prepare for winter will surely starve.
But John Bogle succinctly pointed out that markets work in the opposite manner. Interfering with your portfolio doesn’t help. It hurts.
Parting Thoughts about the Updated Trinity Study
At the end of the day, we don’t know what the future will look like. Today, I chose what most people would consider an overly pessimistic view. It can be scary, but as the Roman civium used to say, “praemonitus, praemunitus.” Forewarned is forearmed.
I’m not suggesting that a 2% SWR is needed. I don’t think it’s the only way forward. But I do think it’s worth the mental exercise. How prepared will you be for a pessimistic future?
There are many personal finance ideas that work this way. You can educate yourself on the objective possibilities, but the final decision really comes down to your subjective feelings about risk.
I hope today’s post brought you a new perspective, and provides you with some objective possibilities so that you can make your best financial decisions.
Thank you for reading! Here are three quick notes for you:
First – If you enjoyed this article, join 1000’s of subscribers who read Jesse’s free weekly email, where he send you links to the smartest financial content I find online every week. 100% free, unsubscribe anytime.
Second – Jesse’s podcast “Personal Finance for Long-Term Investors” has grown ~10x over the past couple years, now helping ~10,000 people per month. Tune in and check it out.
Last – Jesse works full-time for a fiduciary wealth management firm in Upstate NY. Jesse and his colleagues help families solve the expensive problems he writes and podcasts about. Schedule a free call with Jesse to see if you’re a good fit for his practice.
We’ll talk to you soon!
It’s an interesting thought experiment, but the idea that the market would suddenly yield such low returns overall – not just an individual company, but the entire market — is unlikely for a number of reasons. It would necessitate a fundamental shift in both how people consume, how businesses operate, and human nature itself. Companies will always seek profits first and foremost for their shareholders, as their charters require of any publicly traded company, so a sustained period of marginal gains is unlikely. More modest and even gains are more likely in a scenario in which a new style of public company charter is passed through legislation, in which sustainability is prized over profitability. It’s also human nature to jump on bandwagons, which is why when stocks move, they often really move, one way or another. The bitcoin bubble of late 2018 is a great example. People were borrowing money to buy bitcoin on the bubble, when it was far too late. And when it started dropping, they all sold in a panic. But lastly and most importantly, Wall Street has too much power to ever let slow growth happen. We saw that in 2018 when the markets crashed – bankers got bailouts without question, while homeowners and even some industries were left out in the cold or had to beg for bailouts. The market recovered in about two years, while employment and other measures lagged. All to say that when you invest in the index, you’re aligning your interests with the most powerful people on the planet. And they sure as heck aren’t going to let anything bad happen to the market long term.
Could there be other factors? Sure. Climate change impacts could drastically make a massive change to how business is conducted. Although I believe the market will most likely find a way to adapt, we don’t know what that adaptation could look like. But my point is that SOMEthing will have to change in order for those low returns to become the norm. And it won’t be subtle.
I am a big fan of planning for the most-likely, not the pessimistic worst case scenario. Pessimism taken to its extreme, would mean we would all assume the market will crash tomorrow and never recover, and we should just all keep working forever. I think for FIRE to work, we need a healthy dose of rational optimism.
Hey Frugal Wheels. Thanks for the thoughtful comment. I agree with a lot of what you wrote.
I’m certainly not planning my life around an assumed ultra-pessimistic future.
But I do like to understand answers to “what if?” questions, and that was really my main goal here. Simply asking “what if the fundamentals change—then how would my retirement plans be forced to react?”
Like you said, it’s a thought experiment. It’s certainly not backed up with real market data, nor am I using it in a predictive sense.
Thanks for reading!
Pingback: Net Worth Targets by Age - The Best Interest - 25th, 50th, 75th percentiles
While it has historically paid to be a market/growth bull, here’s some bearish perspective for your consideration:
1. A lot of growth has come from additional workforce. Boomers followed by dual income households. People also used to work a higher % of their lives (i.e. expected life duration has increased more than expected retirement age).
2. Growth has largely been fueled by debt, particularly in the US. It is unclear how much further debt can be issued given low/negative interest rates (which will need to remain low due to the huge amounts of existing debt). It is true that with lack of fixed-income options, equities may continue to froth but the actual cashflow/dividend returns will continue to decrease so you’ll need to rely on high P/Es.
3. Taxation could take the wind out of the market’s sails to deal with the above mentioned deficit/debt issues.
4. All of the money printing and push to repatriate manufacturing could lead to inflation rates that outpace share price growth.
5. Demographics. While there may be a windfall of income from the death of boomers that is inherited by millennials, a lot of that will likely go to servicing debt or first-time home purchases. It’s likely taxation will take a big hit out of any passage of wealth given social security and pension funds have become unsustainable and could suffer from a very negative ‘death loop’ if the bubble in junk bonds and equities is allowed to deflate.
Bailouts and all sorts of funny manipulation has been caused by the US Gov’t and Fed (and other governments / central banks to a lesser extend) which has inflated a massive bubble for the last decade (and arguably since the last 70s). To expect the bubble to grow another 50 years is too optimistic for me.
Dave, thanks for the comment. You raise thought-provoking bearish points. How much growth is actual growth? vs, how much is either non-repeatable or gov’t magic tricks?
Re: the bubble—your idea reminds me of the “index fund bubble.” Are you familiar with that idea?
For a realistic example of a “bad” market, look at the Nikkei 225 post 1989 bubble. I actually wonder if we can rerun some of the Trinity simulations using the Nikkei (not predicting anything – the US market is significantly more diversified, but we’re starting to pull the same levers – e.g. FED purchases of bonds and possibly wading into the stock market at a later did, that the BOJ did in the 90s). Japan also got hit with the demographic problem earlier than most other western countries. So for all of the pessimists out there, it’s a troubling parallel.
Pasha, thanks for reading and commenting. The Nikkei crash (and subsequent lack of growth) is certainly something to consider.
That said, are you familiar with Richard Werner? I was listening to him speak a few weeks ago on Odd Lots podcast. He brought up some very interesting points about Japan’s issues in the 80s and 90s. It seems that Japan’s mistakes aren’t too parallel to today (at least in my understanding).
Podcast link: https://www.bloomberg.com/news/audio/2020-05-21/what-japan-can-teach-us-about-re-igniting-the-economy-podcast
Anyways, hope to hear more from you.
Best,
Jesse
Pingback: Here is Your Ultimate Guide to 2 Player Card Games - Bella Wanana
Pingback: The Ultimate Guide to 2 Player Card Games (So You Win Everytime) | Money Life Wax
Pingback: The Complete Guide to 2 Player Card Games
Pingback: Start Your FIRE: A Modern Guide to Early Retirement - Physician on FIRE
Pingback: Ultimate Guide to 2 Player Card Games - The FRUGAL TOURIST
Pingback: The Best 2 Player Card Games - Partners in Fire
Pingback: Your Ultimate Guide to 2 Player Card Games - Money Saved Is Money Earned
Did you by any chance look at a one percent withdrawal rate? Extrapolating your first table it looks pretty ironclad.
The nice thing about writing a script? Very easy to change variables!!!
Sweet. 1% is where I’m at!
I agree with all this FrugalWheels. In my opinion, however, the biggest risk to long-term portfolio growth is that the “most powerful people on the planet” take their toys and go to a foreign (i.e. not American) market. I am not quite sure how it would play out, but it seems that the country running too high of a deficit for too long could eventually have negative implications on the country’s creditworthiness, which could then start affecting the factors you listed above and make the country less hospitable to businesses (at least as compared to other countries). Or too high of corporate taxes for too long could force companies to move more and more of their operations offshore and eventually result in new business listing in foreign exchanges.
Nice, your comments section is poppin off! Really good article to get some perspective. Great visuals as always, though its been a while for me. Question. What about re-allocating to higher risk portfolio after down years and to lower risk portfolio after good years, as opposed to putting it in cash? Also, it might be interesting to see a yearly re-weighting to lower risk over time as death becomes imminent and fund reliability decreases chance of taking up free climbing and base jumping with those squirrel suits
Jesse, this is very close to the SWR strategy that I am working on and hope to incorporate into my own retirement plans. I am in the theoretical design stages of a simulation to test it, but I wonder if your spreadsheet could be relatively quickly tweaked to deliver the answers I am looking for.
My Idea is:
1. The typical bear market lasts less than a year, rarely more than 2 years. What if you had 2-3 years’ expenses in cash? You could completely avoid withdrawals during a bear market.
2. Bonds are used to smooth out market volatility, but a 50/50 stock/bond portfolio means a lot of money is under-performing for decades. Cash would earn even less, but would account for much less than 50%.
My hypothesis is that 2-3 years of cash would allow you to completely skip over a bear market, which would eliminate the need to hold any bonds at all. In other words, you could safely hold an all stock portfolio, which would perform better in the long run than a 50/50 split, and all of this would come together to improve the success rate for the portfolio.
This strategy is especially relevant to the FIRE crowd, because I would argue that an early retirement carries less risk than a a conventional one. This is because the biggest cause of running out of money on a 4%-type of withdrawal plan is when a deep and prolonged bear market hits early in retirement – before the portfolio has had time to build up extra strength. An older person might just have to deal with that reality and hope for the best, but a younger person could put retirement on hold and return to work. He might also have a lot more flexibility to reduce expenses. An early retiree with 2-3 years of cash on hand and an all stock portfolio ought to have very little to worry about with a 4% withdrawal rate. I believe portfolio failure under these circumstances would involve a global catastrophic event in which the only winning portfolio would be guns, seeds, and brains.
Anyway, I’m not sure exactly what the draw-down/replacement algorithm looks like, (It would be nice to make that variable) but maybe when the market is not down more than 20%, withdrawals are taken from stocks. If the market is down more than 20%, withdrawals are taken from cash. And when the market is up 10% from any previous stock distribution, stock is liquidated to replenish cash reserves. Maybe the replenish function has various levels – i.e. 50% when stocks are up 10% and 100 percent when they are up 20%.
What do you think? Is that something your simulation could handle without too much re-programming?
Cool idea, Machinist! Have you tried any sort of back-test against historical markets?
I’m guessing an hour or two of work to get these rules coded up and working properly 🙂
Thank you for sharing your valuable insights on trinity study. Being a beginner at stock market, you are afraid to make decisions that might lead to severe losses. You have promptly explained the trinity study with examples with make them more easy to understand.
Thank you for sharing your valuable insights on trinity study. Being a beginner at stock market, you are afraid to make decisions that might lead to severe losses. You have promptly explained the trinity study with examples with make them more easy to understand.
Thanks Nutan!
Jesse,
I like the basic idea of what you’re doing here, but…there’s are a couple fundamental analysis problems, plus another subtle one, that need to be corrected before this can be useful
Your simulation pictures claim at the top that you’re using *real* returns, but then you note on the side that they are actually nominal returns! It’s really kinda meaningless to look only at nominal returns, unless you think that inflation is roughly fixed – and even then you need to know what that amount is! Without correcting this, your numbers look WAY worse than anything anyone else shows, but it’s because you’re comparing apples and oranges
A second problem is that using average returns with a Monte Carlo simulation ignores the problem of Sequence of Returns risk. I.e. big negative returns early on in the process causing you to consume your seed capital from withdrawals and leaving you insufficient capital to make it up when the returns ar elated big positive (to get you to the long-term average you’re assuming). Ow *this* problem when uncorrected will show results that are *too* optimistic some of the time. The Early Retirement Now site covers these issues in (extreme) detail for anyone interested.
Those are the biggest ones. A third, more subtle, problem is that Monte Carlo simulations don’t exhibit reversion to the mean as do studies like the Trinity and Pfau studies. So you get too many scenarios that are way too optimistic and way too pessimistic. Perhaps for this purpose you consider that a feature and not a bug. If so, fine, but IMO the results are WAY too off when done this way – especially the extremes you say you want to look at.
I loved the explanations in the first half of your piece; I think they are particularly helpful in educating folks new to the subject. But without fixing the problems with your simulations, I fear you will be misleading many folks into potentially bad decisions.
Hi Andy, thanks for the detailed feedback. Let me see if I can answer…
1) Ugh. Good catch. That’s mislabeling, nothing more. The returns are NOMINAL. The top/title is mislabeled. Then 3% inflation is assumed each year. Real returns, therefore, fall between 0% and 4%.
2) My Monte Carlo does not ignore Sequence of Returns risk. I’m simulating a 3% monthly standard deviation on returns, per Burton Malkiel’s data. This is the very point of the Monte Carlo—to vary market returns over time. This captures the risk from a sequence of bad returns.
3) Monte Carlo simulations can capture reversion to the mean if assuming an Ornstein-Uhlenbeck (or similar) data behavior. I do so for this data. It’s pretty neat.
On one hand, markets exhibit momentum. They stick to their recent trends. But on the other hand, they revert to their means…which can go against momentum. And then there’s a third factor: randomness.
A basic Gaussian distribution in a Monte Carlo model would only account for the randomness variable. Not very helpful here.
But the Ornstein-Uhlenbeck accounts for a momentum factor, a reversion-to-mean factor, and a random nessfactor. All three play a role, and all three are considered in this simulation.
Hopefully this response is somewhat satisfactory to you! Thanks again for the feedback! 🙂
-Jesse
Ok, well 0%, or even 2%, real returns over 30 years is beyond pessimistic (for anything short of, say nuclear war, or the country being taken over by fascists or communists). It means you’re suggesting that after paying dividends, the company stock values in aggregate will decrease in value over the course of 30 years. It’s one thing to model that over 10 years, and then resume something close to “normal“ growth the following 20 years, but over 30 years that low level of returns I think is pretty meaningless.
Re: the rest of the aspects of the simulation, thanks for the explanation about Orenstein-Uhlenbeck; I’ll have to look that up further. Still, it seems to me that if you’re modeling only the annual (or monthly) *aggregate* return of your portfolio, rather than modeling equities and bonds separately, you’re missing an incredibly important aspect of mean reversion, as it is the mean version of equities separately, in particular, that is the most important thing to capture, IMO, re: investment returns, not mean reversion in the combined balanced portfolio.
Pingback: Retire Early and Rich: How to Calculate Your Safe Withdrawal Rate – Radical FIRE
Can you please share your analysis excel files