Monte Carlo Simulation is a cool, powerful, and simple method for modeling seemingly random scenarios. Today, I’ll go over the basics of Monte Carlo simulation. We’ll walk through a simple example together. And then I’ll link to some of the cool ways I’ve used Monte Carlo here on the Best Interest.
The Basics of Monte Carlo Simulation
When you hear “Monte Carlo simulation” you should think “lots and lots of random trials.”
For example, you might ask, “How often does a Texas Hold ‘Em player get dealt two aces?” A true statistician would be able to use statistical equations to answer that question.
But you could also use Monte Carlo analysis. You could teach a computer to randomly deal a two-card hand, and then repeat than random dealing another billion times. Over those billion random trials, an accurate probability of a two-ace hand will become apparent.
Cards and dice and darts are easy targets for Monte Carlo simulations. But they can also be used to on more complex models, such as weather predictions.
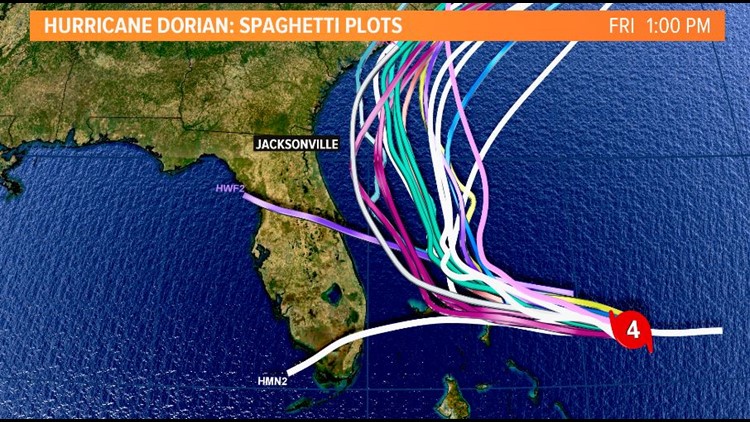
For example, the “spaghetti plot” above is a product of a Monte Carlo simulation. Meteorological models utilize fluid dynamics—which is famously unpredictable. That “unpredictability” can be tamed using the Monte Carlo method!
Unsure whether the winds will shift faster or slower? Simulate both a million times. East or West? Warm water or cold water? A hurricane’s path might depend on a million different variables. Monte Carlo simulations can take those million inputs, vary them millions of times, and then output a huge range of results.
One set of inputs says, “Miami, get crushed.” Another set predicts the hurricane won’t even make landfall. Over millions of simulations, a probability distribution emerges. Miami might only get crushed in 0.001% of the results—it’s probably safe.
Monte Carlo Simulation Origin and Naming
You might recognize Monte Carlo as the name of the famous casino in Monaco. Indeed, the two mathematicians (including the famous John von Neumann) who developed the Monte Carlo method named it after the gambling house.
But their original purpose for Monte Carlo simulations was anything but fun and games. They were working on nuclear weapons at the Los Alamos National Laboratory.
Unsure how deep a high-energy neutron will penetrate fissionable uranium?
Just simulate its random path a billion times.
Monte Carlo Simulation – Finding Pi
Let’s put the Monte Carlo method to work!
The mathematical value π, or pi, is the ratio of a circle’s circumference to its diameter. The ancients—Egyptians, Babylonians, Greeks, Indians, Chinese—all realized that understanding pi was essential to mathematics, astronomy, and engineering.
But the problem is figuring out exactly what the value of pi is. We now know that it’s 3.1415926535…but how could we find that out without a complicated algorithm?
One answer, as you might guess: a Monte Carlo simulation.
The Monte Carlo Simulation Setup
This simulation is beautifully simple.
Imagine a 2 x 2 square. And inscribed in that square is a 2″ diameter circle. It looks like this.
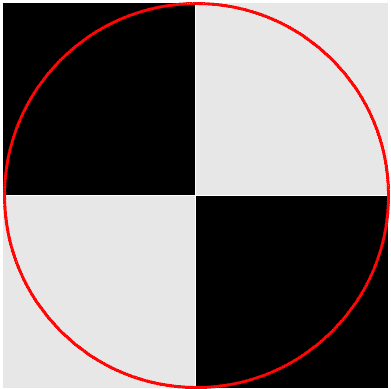
Each small square is 1 x 1. We know that the area of the full square is 2 x 2, or 4 square units.
We also know that the area of the circle is π*r^2, where r is the radius of the circle. Conveniently, the radius here is 1. Therefore, the area of the circle is pi square units.
Now let’s introduce some Monte Carlo simulations. Imagine I had a million monkeys randomly throwing darts at this target. How many darts would we expect to land inside the circle?
The percentage of darts inside the circle would be equivalent to the area of the circle divided by the area of the square. 100% of the darts land in the square, but a lesser percent end up in the circle.
If the circle occupies about 70% of the square, then we expect about 70% of the darts to hit inside the circle. Makes sense, right?
Conveniently, we already know that ratio of areas. It’s equal to pi (the circle’s area) divided by 4 (the square’s area). If I had a million (or billion, or trillion) monkeys throw their darts into the square, the percentage of darts that land inside the circle would be equal to π/4.
If I take that percentage and multiply it by 4, then I’m just left with π. And that’s that.
I’ve discovered π.
Finding Pi in Action
Let’s get those monkeys working!
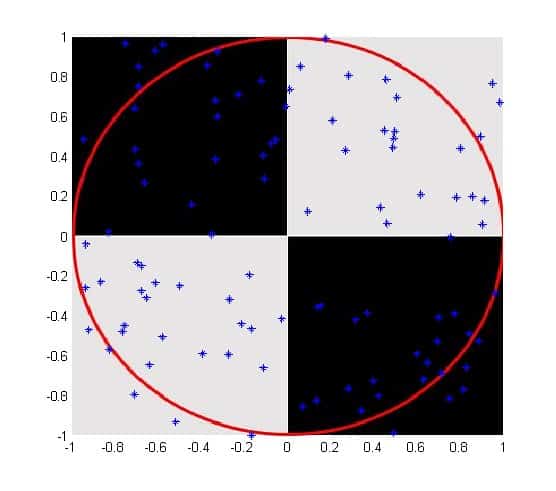
100 Darts
To keep things simple, let’s start with 100 darts. I ran one trial of 100 darts and 79 of them ended up inside the circle. If we use our equation above, we take 79/100 and multiply it by four. That gives us 0.79*4 = 3.16.
Our first estimate of pi is 3.16.
I could run this Monte Carlo simulation again and—perhaps—only 72 darts end up in the circle. Or 75. Or 81. There’s a random element at play here. Small data sets—like only 100 darts—are typically more affected by randomness than larger data sets.
That’s why Monte Carlo simulation is all about the power of big numbers. As we throw more darts, the noise of randomness becomes increasingly quiet. And it’s easy for computers—in this case, the software MATLAB—to simulate lots of monkeys throwing lots of darts.
100,000 Darts
So, next I asked my MATLAB monkeys to throw 100,000 darts.
78,535 darts land inside the circle, which means this estimate for pi is 3.1414.
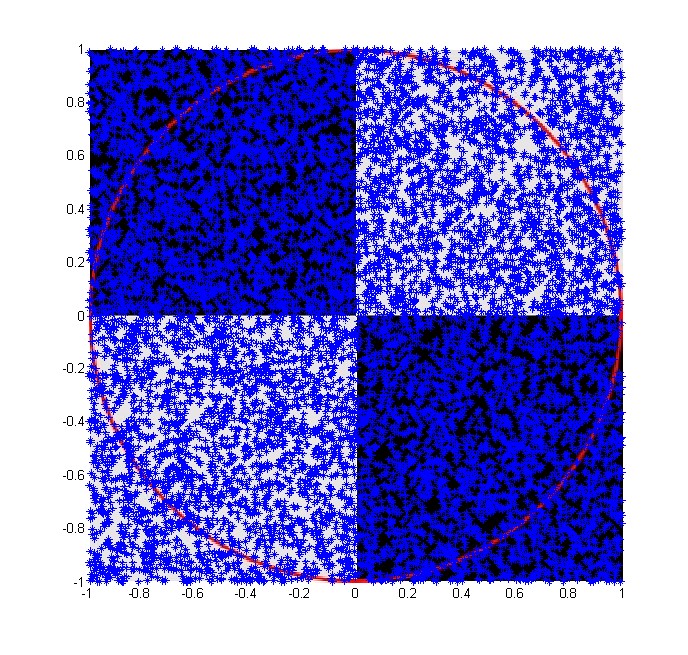
10,000,000 Darts
For good measure, let’s do one more. I’m going to employ every monkey on Earth, all ~10 million of them. I’m not even going to show you the target, because it just looks like a block of blue dart holes.
7,854,485 of the darts land inside the circle. That’s higher than most monkeys can count.
This estimate for pi is 3.141794.
The actual value of pi is 3.141592…
Out of 10 million darts, the monkeys hit the target about 600 times more than expected, for a percent error of 0.0006%. Not bad.
P.S.—For every dart, I randomly assigned it a landing point on the board, and then did some quick math to ask, “Is this dart inside the circle?” That math was calculated for each of the 10 million simulated darts. It took MATLAB 66 seconds to do all that math. Computers are fast.
1000 Trials, 100,000 Darts Each
One last simulation. This one will show you the variation that can occur from one trial to the next. 1000 trials, each of 100,000 darts.
Below is a histogram showing the frequency of results from those 1000 trials.
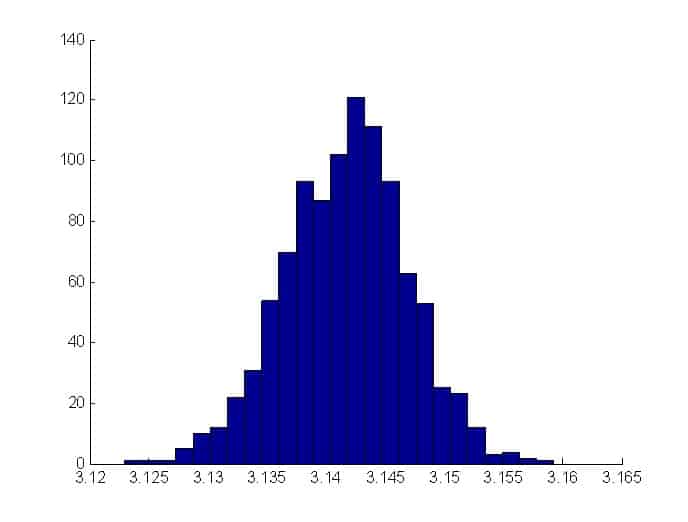
Some monkeys walk away thinking pi is 3.12. Others think 3.16. But a clear and correct pattern emerges when all the data is examined. The most likely value of pi is right around 3.14.
Monte Carlo Simulations and Money
Why did I bother writing about Monte Carlo simulations today? Am I suggesting that your best bet in personal finance is understanding the roulette table?
No, not at all. Most of the “secrets” of personal finance are simple, and most of your personal finance goals should be basic.
But Monte Carlo simulations have financial use (albeit limited) when the exact results of a future scenario are unknown and/or completely random. For example, the stock market!
Now, I know that some detractors will immediately have a visceral reaction to the idea of simulating the stock market. I understand. And I address those concerns below.
But if we are to believe that the stock market has a significant aspect of randomness to it, then a Monte Carlo simulation should help us understand a possible range of outcomes in the future. It could even help us create a probability distribution of possible outcomes.
For example, the last of these five helpful plots uses Monte Carlo simulations to examine portfolio performance.
And this updated Trinity Study 4% Rule also uses randomized Monte Carlo simulations to examine how the “4% rule” of retirement might change in the future.
Did you read the results of the Best Interest stock picking competition? I won’t spoil the results. But it’s a perfect example—and a great lesson—in simulation randomness.
But you can’t model the stock market!!
To the detractors—I understand. Anyone who builds simulation models for a living will tell you that the downfall of models is “garbage in, garbage out.”
Imagine I go back to the Monte Carlo model that predicts how often I’ll deal two aces. An important assumption that goes into that model is that a deck has 52 cards. Another important assumption is that 4 of those 52 cards are aces.
If I get those assumptions wrong—say, 4 aces out of 42 total cards—then my result will be completely wrong. My mistaken input—garbage in—will lead to an incorrect output—garbage out.
The same thing happens when simulating the stock market, except the market is significantly more complicated than a deck of cards. Anyone who tries to model the market—including yours truly—is getting something wrong. For example:
Is picking stocks just like a coin flip?
Is a ‘random walk’ truly random?
Do stock returns best fit onto a Gaussian distribution, a Laplacian distribution, or an Orstein-Uhlenbeck distribution? (Yes, the sharp nerds at Reddit called me out on this one.)
These are all good questions, and they rightly poke holes in my attempts to model markets using Monte Carlo simulations.
That’s why I constantly nag you to use boring investing methods. Just index and chill.
While I (obviously) think Monte Carlo simulations have their place, I’m not putting all my trust into dart-throwing monkeys. Nor should you.

Randomness happens, and Monte Carlo simulations can help tame that randomness.
I hope you continue to roll the dice and return for future Best Interest articles. If you’re feeling really lucky, consider signing up to get these articles dealt straight to your inbox.
Very cool maths. Hadn’t thought about how you can get pi, a ratio of distances, by looking at the ratios of corresponding areas. A few question about indexing, though forgive me if you’ve covered them already and I’ve missed it. It seems that there’s nothing necessarily diversified about say the s&p 500, when it is increasingly dominated by one sector, tech. I guess it’s just a trading algorithm that weights most highly the most successful US listed companies? But is there maybe an alternative algorithm that is more global or more diversified with similar or greater returns? But then the S&P 500 seems to have the best historical returns. Is this due to higher volatility? If so, is there a way to use a volatility/ correlation metric to create a portfolio that performs as well as an index fund? Or just not worth it? It does seem like a fair bit of effort. I love the index and chill mentality.
Hey Bill. You’re right in that the S&P is increasingly dominated by the big tech stocks…Facebook, Apple, Amazon, Alphabet (Google), Microsoft, Netflix, etc.
One could always choose to invest in a total market fund rather than just an S&P 500 fund. Total Market would provide far more exposure to mid-cap and small-cap stocks than an S&P fund would.
Re: you final volley of questions, there are algorithms and corresponding mutual funds for just about any tactic or strategy under the sun. I feel like you’d really enjoy A Random Walk Down Wall Street. I’m sure your library has it, or here’s the Amazon link.
Haven’t read this book yet, but I have heard of it and am sure I’ll get around to it as some point now that you mention it. I’ve already got a catalog of books that I’m chipping away at.