Today, we’ll take a look at five basic finance plots–from the random walk to mortgage cost comparisons–that belie some important ideas. Let’s dig right in.
How often will you double your money?
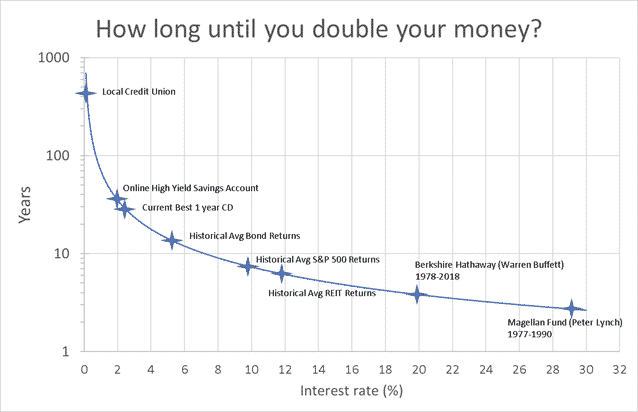
Why is Warren Buffett so rich? In simple terms, it’s because he’s doubled his money more than 11 times over the past 40 years. That’s not 2*11 = 22. It’s 2^11 = 2048. Buffett’s holding company–Berkshire Hathaway–has increased in value over 2000x since 1978. Simple folks who invested $1000 with Buffett in 1978 now have over $2 million.
If you expect historical returns in the stock market, you’ll double your money about every 7 years.
How long would it take you to double your money if it’s sitting in a safe online savings account? Probably about 35 years.
Another way of thinking about the illustrious compound interest is to ask, “How often will you double your money?”
The Silent Killer
Debt. Silent but deadly. Of all of today’s basic finance plots, this is the banana peel.
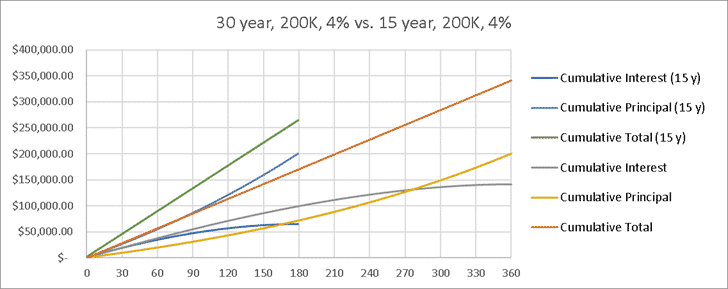
For a 30-year mortgage on a $200K house at 4% interest, you’ll make $141K in interest payments. That’s the bank’s fee for lending you money. It ends up being about 70% of the total that you borrowed in the first place. Yikes!
If we take that same mortgage down to 15 years, you’d pay $65K in interest payments, or about 33% of the total you borrowed.
The quicker you get out from under the debt monkey, the fewer bananas it steals.
The Expens(iv)e Ratio
Just about every investment firm, mutual fund, or 401(k) plan charges something called an “expense ratio.” It’s the fee that you’re charged, and it’s expressed as a percent of your total investments. They seem small, but expenses ratios are another example of something that really bites you over time.
In this very reasonable example, our investor puts $5000 a year into an investment that grows at 7% per year. But how do different expense ratios affect the final nest egg after 35 years?
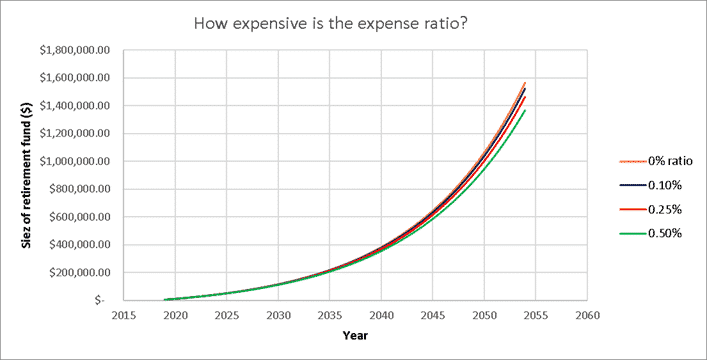
Compared to the other basic finance plots, these results look pretty similar to one another. But hopefully this plot shows…a “small, harmless” expense ratio of 0.5% costs our investor 13% or $197K of their retirement fund, as compared to a fund with no expense ratio. $197K!!
A expense ratio of 0.1%—which is actually fairly good for the industry—costs our investor about 2.5%, or $42K. Still…that’s quite a lot!
Granted, these firms or funds are doing a lot of the “dirty work” on our behalf, and they deserve some compensation for that. But you are the one putting up all the money. You’re the one taking all the risk! Take another look at this basic finance plot–don’t let high expense ratios take away your reward.
The Savings Rate: Basic Finance Plots for the FIRE-y youngsters
While some folks still consider 65 to be the retirement age, more and more people are targeting FIRE.
A quintet of quintuplets get identical jobs. They’re 22 years old, just out of college. Each makes $50,000 per year. But they differ in their lifestyles. The eldest (and therefore wisest) spends 50% of her income and saves 50%. The youngest spends 90%, saves 10%. The other three spend/save 80/20, 70/30, and 60/40, respectively.
We make some investment assumption (7% returns) and inflation assumptions (2% per year).
The quintuplets will use a simple retirement requirement. They will each save to a point where their annual investment growth (7% positive, 2% negative inflation), fully pays for their yearly spending.
But since the eldest spends less, her nest egg doesn’t need to be as big. And also because she spends less, it means she can save more each year. It’s a great double-whammy! Both the small nest egg and greater savings mean she can retire much sooner.
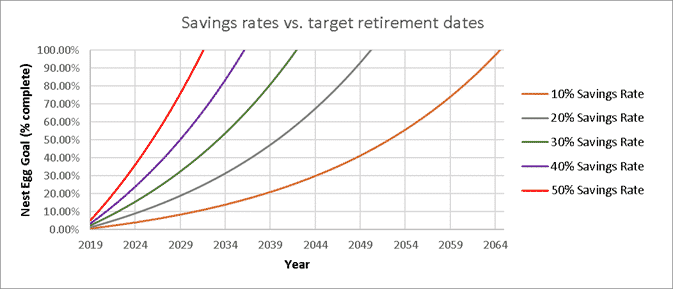
The FIRE movement captures this idea using the metric “Savings Rate,” which is the [Amount you save] / [Amount you save + amount you spend].
Even a simple change in Savings Rate from 10% to 20% (our two youngest quintuplets) results in a 14 year difference in their retirement age.
Our eldest quintuplet could retire at age 35, only 13 years from now. But the youngest? Not until 68.
Random Walk
So far, I’ve made some simple assumptions today like “the market will yield 7% returns per year.” In truth, rates of return are highly variable. Some years are great (the S&P is up 19% as of September 25, 2019). But in 2008, the S&P dropped 37%.
In “A Random Walk Down Wall Street,” author Burton Malkiel offers a historical average market return of 1% per month with a 4.5% standard deviation. The market tends to go up (the average is positive), but there’s a high variation in these returns (high standard deviation). When you plot it out, it looks a bit like a confused pedestrian going for a random walk.
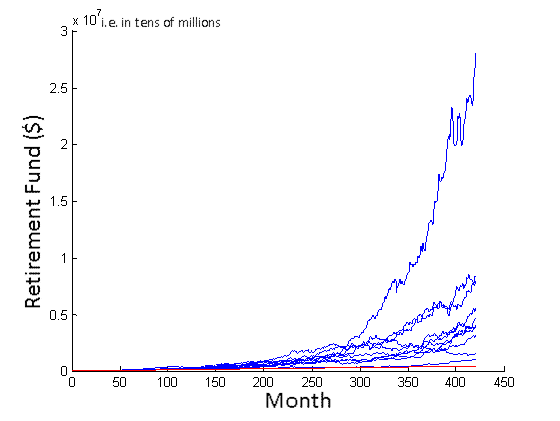
As a nerd, I wrote a MATLAB script to run through some simulations using this data. For a given month, I invested $1000 and then assigned a random rate of return using the average and standard deviation. Then, I simulated 35 years, or 420 months—a typical American career. And then I simulated that career, randomly, 100,000 times. Ok…so maybe this is the least basic of the basic finance plots. But I think you’ll find the following explanation fairly straightforward!
This plot simply shows 10 random results (out of the 100,000). The best of the 10 here shows a $28 million retirement fund. The worst? $1.1 million. The average was $6.8 million. And the red line shows the “Mattress Technique” of investing, whereby the investor stuffs the $1000 per month under his mattress. After 35 years, that investor will only have $420K.
When I ran the 100,000 simulations, the results were:
- Average: $6.51 million
- Median: $4.85 million
- Max: $139 million
- Min: $290K
- Total Failures: 12 out of 100000 cases did worse than the Mattress Technique
- Partial failures: 101 out of 100000 cases did worse than a 2% Savings Account (think Ally, Marcus, or Betterment)
But that means that 99.9% of the simulations did better than simple savings accounts…that’s the power of the market, even with some “random walk” involved.
I could use a more conservative average return. Rather than 1% per month, let’s use 0.72% per month—that leads to 8% average growth per year. In this simulation, the results were:
- Average: $2.7 million
- Max: $43 million
- Min: $172K
- Total Failures: 519 out of 100000 cases did worse than the Mattress Technique
- Partial failures: 2713 out of 100000 cases did worse than a 2% Savings Account (think Ally)
Not as good, for sure. BUT, we’re still looking at ~97% of the simulated scenarios doing better than a simple savings account. I like those odds.
UPDATE: a friendly Reddit user suggested I use a Laplacian distribution instead of the Gaussian distribution that I originally used for this. Why? The Laplacian is a better model for “long-tail” behaviors. Long tail? It’s when you’ve got a behavior that’s very stable most of the time–and therefore “tall” at the average–but occasionally has an extremely unstable event. This unstable event occurs very far from the average, and thus gives the data graph a “long tail.”
The S&P 500 provides perfect “long tail” data. If the S&P matched a perfect Gaussian distribution, one would expect a single-day 4% drop to occur about once every 60 years. But in reality, a 4% drop occurs more than once per year, on average! Clearly, the Gaussian is missing something. So let’s see how a Laplace simulation works out (using 1% average monthly returns):
- Mean: $6.50 million
- Max: $158 million
- Min: $221K
- Median: $4.87 million
- Total Failures: 17 out of 100000 cases did worse than the Mattress Technique
- Partial failures: 122 out of 100000 cases did worse than a 2% Savings Account (think Ally, Marcus, or Betterment)
As one might expect with Laplace, the tails are more significant. A higher max, a lower min, and more failures. The median and average, however, are very similar.
Five basic finance plots. A lot of important info. I hope learned something today, and please come back to re-visit these ideas in the future. And thanks for reading the Best Interest.
True! Must be a quintuplet thing, then?!
The youngest sibling is the most fun though
I ran a script in R trying to replicate your results from the Random Walk section using the Laplace distribution, but I’m finding consistently worse aggregate results than what you describe in your article. For example, my median account balance after 35 years of $1000 monthly contributions is $1.893 million and a mean balance of $2.729 million.
That’s cool, Tony!
We can probably find the difference. Let me ask…what did you use for avg monthly return? 1%? Or 0.72%?
-Jesse
I ran a few different ones. For one, I used the mean monthly return of the S&P 500 index ~0.619% per month. But for the results I described in my comment, I used the monthly return you mention in your article: 0.72% per month. As far as I can tell, I did everything you did.
Perfect. So, when I ran 0.72% per month, I also got a mean of $2.7 million—same as you. That’s also what I report in the article.
The larger sums—eg 6.5 million—were for a 1% return per month.
How do your results look when you use 1% per month?
Aha! Now, I’m seeing some agreement. My median now comes out to $4.319 million and a mean of $6.460 million. My total failures were 179 out of 100,000 simulations. Not exact but much closer to your own findings now. Great, I thought I was doing something wrong.
That’s awesome! Glad to see some agreement between the results.
Thanks for checking my work 🙂
I ran a script in R trying to replicate your results of the Laplace distribution simulation, but I’m finding consistently worse aggregate results when I run a near-identical simulation. For example, after 35 years of $1000 monthly contributions my median account balance comes out to $1.893 million and a mean balance of only $2.729 million.
Pingback: Semi-Retirement Savings Rates - How Much Do You Need to Save? - Semi-Retire Plan
Pingback: The Habit of Saving: Baby steps, penny by penny, learning to save