The stock market feels like it’s imploding. Accounts are being ravaged. It’s only natural to think, “What should I be doing? What stock market strategies do I need to implement?”
Sound familiar? Well, keep calm. I’ll explain why.
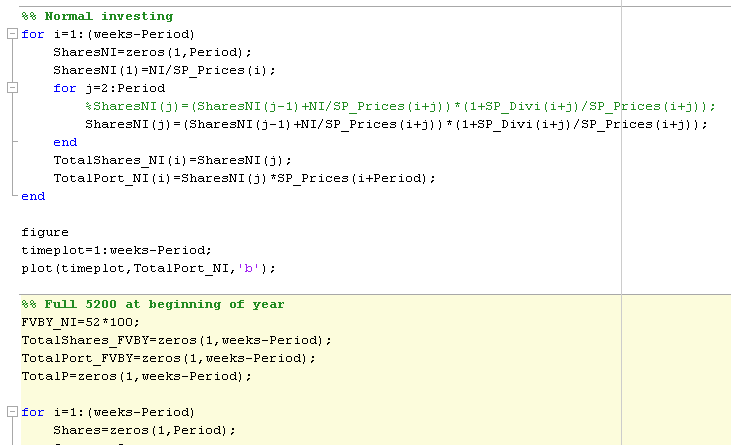
I spent the last week poring over S&P 500 price history, and used MATLAB to back-test a bunch of “investing strategies” during the stock market’s history. I worked on a mini-version of this last weekend, and hundreds of people gave me feedback on Reddit. They inspired me to turn it into a full post. This article distills that research into a format suitable for your consumption.
If you’re interested in looking at my code, find it here on GitHub.
Below, you’ll find charts describing how various stock market strategies have performed over the last century.
While a global pandemic is certainly spreading–and it’s also Friday the 13th–writing this made a huge impact by calming my investing and financial thought process during this turbulent time. I hope reading it will do the same for you.
The Highlights or TLDR
I want you to know what you’re getting into. It might take ~20 minutes (quarantine reading?!) and a nice monitor to parse through some of the plots.
Here are some of the stock market strategies that I looked into and built charts for:
- “Normal” investing, similar to the American 401(k), with a small fixed S&P 500 investment and a high fixed frequency (e.g. weekly). Some people call this “dollar cost averaging,” although it’s a contentious definition.
- Lump sum investing. Put money in to the S&P, and wait 30 years.
- Annual lump sum. Put money in to the S&P, wait a year, and repeat.
- Waiting for a 10% market drop before moving money from low-risk investments into the S&P
- Same as above, but for 20%, 30%, and 40% market drops
- Same, but for 5%, 2% and any market drops
- Hedge strategies, combining “normal” and “market timing” methods
- Borrowing from an extra cash fund to invest when the S&P is low
- Comparing 10-year, 20-year, 30-year, and 40-year periods to understand how investment duration affects results
And the important result: it’s really, really hard to use any “market timing strategy” to beat plain normal investing.
Stay calm in your investing life. Based on historical data, your attempts to time the market have a strong chance to hurt you in the long run.
Quick Background
Last week, I wrote a Best Interest piece about the coronaviral stock market. In short, I had some criticisms for Twitter “experts” who were counseling their followers to “buy the dip!” in the market.

The books and research that I’ve read (e.g. Bogle, Malkiel) suggest that holding onto cash into order “buy the dip” is a losing strategy over the long-term. Sure, buying low is great. But “holding onto cash” while waiting for the dip gets you into trouble. I felt that these Tweeters were (unintentionally) misleading their followers. Blasphemer!
After publishing my mostly-qualitative criticism, I wanted to back it up with some quantitative analysis. I pulled the last 30 years of S&P 500 data and coded up a quick “buy the dip” strategy to compare against a “normal” strategy (e.g. 401(k) investing).
I shared my work with a few different Reddit communities. If you’re interested in seeing that work or those Reddit conversations, I’ve linked them below. However, the charts in today’s article are far more useful.
- Subreddit for Financial Independence
- …for “Fat” FIRE
- …for Financial Planning
There was tons of positive feedback from Reddit:


And some negative feedback:
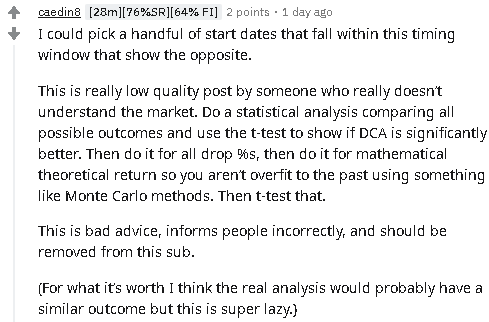
…super lazy?! Why I oughta…
But most importantly, there was plenty of constructive feedback. I received dozens of suggestions for improvement and recommendations for further analysis.
It was a fantastic brainstorming session. And below, you’ll see the results of all those suggestions.
Just to emphasize…
Before we really dig in, I want to emphasize: I understand that investing on March 13 is a 35% better deal than it was on February 20.
If someone has been waiting for a big crash, this sure seems like an ideal time for them to pull the trigger and commit their money.
But the point of today’s post is to show you how the logic that led them to this point is deeply flawed.
Let the analysis begin!
All good experiments should set some sort of baseline. To get some housekeeping out of the way, here’s my baseline:
- I pulled S&P 500 data from 1928 to today. Source: Shiller. While Shiller’s data set goes back to 1871, it’s more common to see S&P data only polled back to 1928
- I assumed that dividends would be re-invested into more shares. This is typically recommended for optimal portfolio performance.
- For most of these charts, I assumed a 30-year investing trajectory. But I do look at some alternatives.
- When I compare different stock market strategies, the underlying principal invested is the same between those different strategies. I chose $100 per week for 30 years, or $156600 total dollars.
- Whenever a strategy involves “holding onto cash,” I assume that the cash is appreciating at the risk-free rate (e.g. Treasury Bonds). For most of the study period, that rate ranges from 3.5%-5.5% annually. Source: NYU Stern
The “Normal” Investor
What’s normal, anyway? To me, the normal investor invests a fixed amount of money at a fixed frequency. For example, Average Jane and her 401(k). The typical American worker contributes the same percentage (fixed amount) each pay period (fixed frequency).
This is our baseline. I’ll refer back to it throughout the rest of the post.
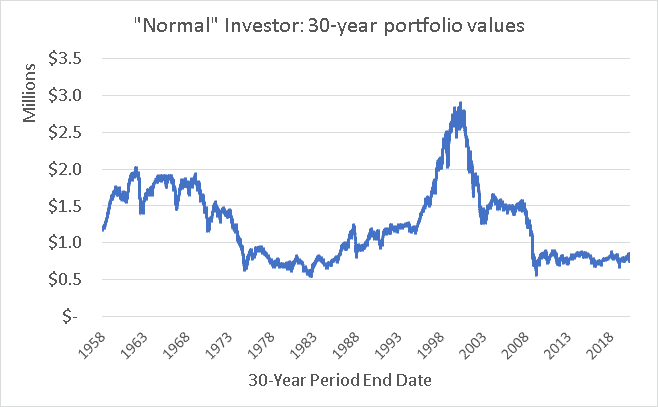
How do we read this plot? For example: I want to know how our normal investor fared if they invested $100 per week from 1973 to 2003. So, I look at 2003 on the x-axis. That’s the 30-Year Period End Date. I see that our investor would’ve ended up with about $1.3 million (from the y-axis).
What are some other notable features?
- Notice that the 30-year portfolios peak as the Dot Com bubble built up in the late 90s. But contrast that against someone who was still invested when that bubble burst…Or when the ’08 Crisis hit.
- Another interesting note. Why do the 2019 portfolios appear to be roughly the same as the 2011 portfolio? I thought the 2010s were a phenomenal decade of growth?
- The 2010s were not that great. In fact, the 1980s were slightly better. So a portfolio from 1980-2010 performs about the same as one from 1990-2020.
The Lump Sum
For our first comparison, I was asked, “what if our investor could choose to invest their $156600 as a lump sum on Day 1 of the 30-year period?” While I don’t think this is the most realistic analysis–do you have $156K lying around?–it does prove a useful point.
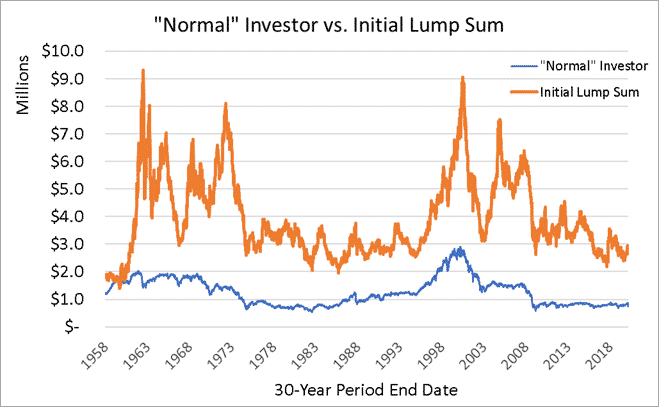
The results are clear. The lump sum investor comes out way ahead. This should re-affirm the adage, “Investing is about time in the market, not timing the market.” If you can get your dollars invested earlier, history shows that they’ll do more work on your behalf.
The only time this wasn’t true? If our investor had lump summed in the weeks leading up to the Great Depression.
This chart is helpful in answering questions about windfalls, inheritances, or other significant monetary gains. If you ever receive a large lump sum, you may wonder whether to invest quickly or dole it out slowly. History would say, “Invest ASAP!”
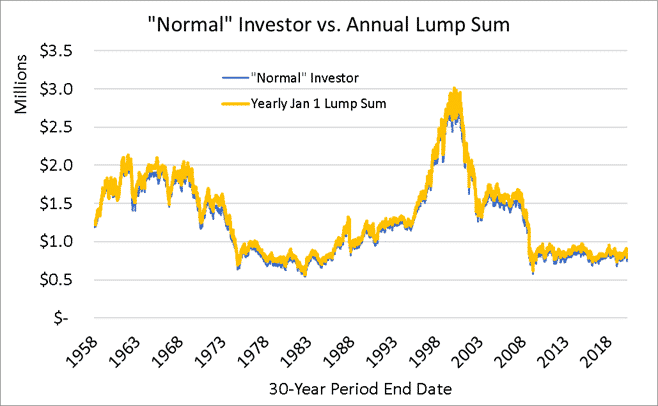
The “Roth IRA Lump Sum”
Roth IRAs present a miniature version of the lump sum scenario. If you choose, you can invest the full annual Roth IRA contribution ($6000 for 2020) on the first day of the year. Or you can spread it out over the year.
This chart shows a “Yearly Lump Sum” investor who chooses to invest $5200 during the first available week of a year. We compare against our normal investor who spreads the $5200 out into $100 weekly increments.
You’ll notice, however, that the data isn’t easy to parse. Is Lump sum (yellow) ahead, or are my lines extra thick?
Ratio results – ‘A’ divided by ‘B’
So to help, I’m going to start showing you a “ratio” or “comparison” plot. I divide one set of data (the “normal” investing) by the other set (Yearly Lump Sum).
If the quotient is greater than 1.0, then I know that normal investing (the numerator) was larger, or better. If the quotient is less than 1.0, then Yearly Lump Sum was optimal for that particular 30-year investing period.
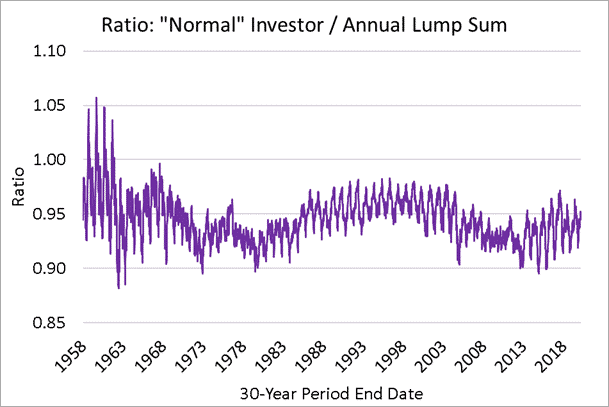
“Normal” investing vs. Annual Lump Sum.
What sticks out?
- First, the plot stays below the 1.0 threshold for the majority of history. This suggests that the “Annual Lump Sum” method of investing is preferred.
- Second, there’s a noticeable oscillation in the data. It took me a while to understand this, but I think I figured it out. They are “echoes” that reverberate through time from previous market crashes. For example:
- At the start of the Great Depression, the market lost 40% of its value in about 4 weeks. It would make a huge difference if our Annual Lump Sum investor happened to invest a Lump before that crash vs. right after that crash. And that difference would be visible for the remainder of the 30-year period.
- This analysis tracks all possible portfolios. Some portfolios evince the bad luck of investing $5200 right before a big crash. But portfolios that were lagging by only a couple weeks would be on the good side of that crash.
- Thus, we’d see a sharp rise or fall over a short time range. The oscillation shows stark differences in near-neighbor portfolios, because those neighbors just happened to be on opposite sides of a large market crash.
Enjoying this article? Subscribe below to get new articles emailed straight to your inbox
The 10% Market Timer
As I wrote about last week, I was miffed that some Twitter “investors” were hollering about the “amazing buying opportunities” after the market had fallen 10%. And it got me thinking–how can we show that waiting for the market to drop is a dumb investing strategy?
So I put together my initial chart, shared it with Reddit, etc. Just to be clear, the rules for the “10% Market Timer” are:
- Each week, put $100 into a “risk free” investment, such as a 3-Month Treasury Bond. This investment increases in value each week based upon the actual historical rates of return.
- Each week, look at the S&P 500 price.
- If the market price is higher than the previous maximum, note that. This is the new high water mark.
- If the market is 10% lower than the previous high water mark, use all of the “risk free” money to buy into the stock market. Then, reset the “previous high” market price to the current price.
Over time, this investor will build up a hoard of cash in their risk-free account. When the market crashes, they’ll buy in all at once. It sounds great!
How does the 10% Market Timer do?
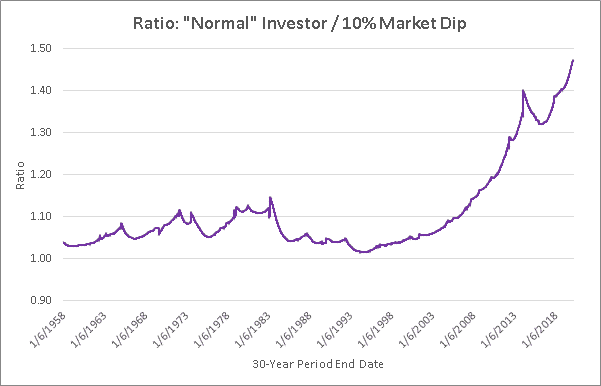
“Normal” investing vs. 10% Market Dip.
Pretty poorly, actually. Reminder: values above 1.0 suggest that the normal investing strategy is preferred. A value of 1.05 means that normal investing was 5% better than market timing. Overall, this plot reaffirms the oft-repeated advice: timing the market is a loser’s game.
We see that there were some times in history where this market timing technique almost paid off. For example, portfolios ending in the mid-90’s show the normal investor only outperforming the Market Timer by ~2%. But being almost better than the normal investing technique is a fairly damning consolation.
On the whole, this 10% market timing rules stinks the place up. Our investor is putting in extra effort and performing 10%, 20%, or even 40% worse than normal investing.
But why?! Buying low should be good!
This result is counter-intuitive for many people. If we save our money and only buy at a low point, how can we be worse off than someone who is buying at all prices?
The rationale, it turns out, is one of the first ideas I ever wrote about on the Best Interest. Investing at “highs” is not intrinsically bad. As an example, look at Amazon’s price history. It hit all-time highs in nine out of the last ten years. Would you have liked to buy-in during the all-time high in 2010? It was trading for $150/share. Now it’s at $1700.
So if you attempt to build up cash and buy at the next bottom, you will likely be worse off than if you had bought every month. Why?
Because while you wait for the next dip, the market is likely to keep rising and leave you behind.
-Nick Maggiulli, Of Dollars and Data
The stock market trends upward over time. Up 30%, down 15%, up 20%, down 10%, etc etc. If you only buy on the dips, then you’re likely to miss out on the better part of the previous rise.
That’s exactly what this first analysis has shown.
The Bear Market Timer
Some Redditors felt that waiting for 10% dips in the market simply wasn’t severe enough. If you want to make money, they said, you need to wait for 20% or larger market drops. You need to wait for official bear markets (like the one we just entered this week).
So, let’s see how this strategy holds up. How does our investor do if she hoards her money in a risk-free investment until a 20%, 30%, or 40% market drop occurs?
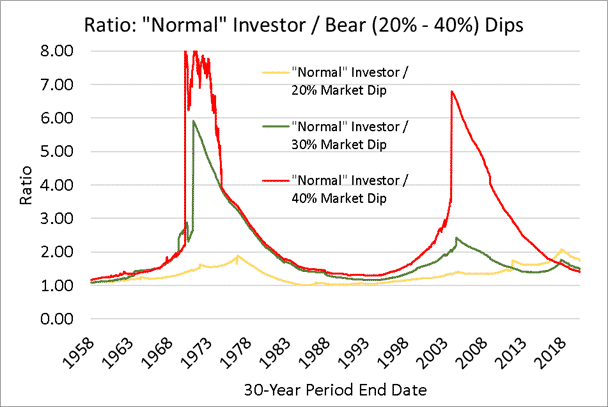
“Normal” investing vs. 20-40% Market Dip.
It’s even worse than before!
The normal investor outperforms the 20% market timer (in yellow) in all historical 30-year periods. There are some close periods e.g. within 2% of one another. But on average, normal investing outperforms by 11%.
The results for the 30% or 40% market timer (green and red, respectively) are even worse. There are historical periods when they got outperformed by 400-700%. By delaying their commitment to the market for long stretches, they missed out on huge growth spurts. These market-timing investors lost out on millions of dollars.
We now see that waiting for the big dip/crash/bear market is not a good strategy. But what about something a little more nuanced?
What about smaller dips?
What if we bought into the market during 5% market slumps? Or whenever there’s a quick 2% drop? Heck, what if we bought into the market every single time it goes down from week to week? We only buy the lows!
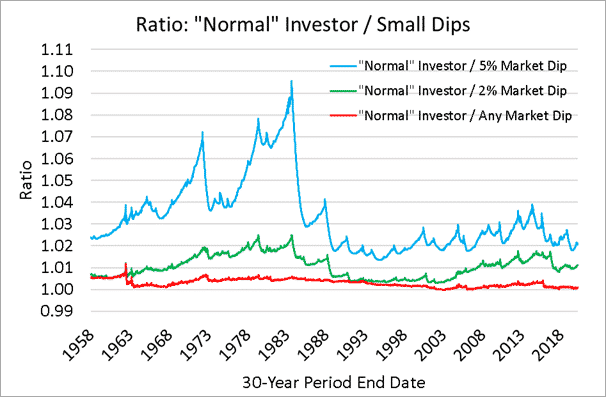
“Normal” investing vs. Small Market Dips
Turns out, we see similar results to the 10% market timer results, but with some attenuation. (Remember: when this plot is above 1.0, it means that normal investing was the optimum strategy during that period.)
It turns out that “buy every single dip” (in red) ends up being a fairly similar strategy to “buy every week.” But that’s because “buy every dip” triggers after 43% of all weeks. Buying ~half the time is pretty similar to buying all the time when your full horizon is 30 years long.
And there’s a price to pay. “Buy every dip” sometimes delays investing by a few weeks or months to wait for a dip. And when that dip comes, it’s not always big enough to justify having waited for so long. It’s the dip-rise argument again. Our investor should have bought in at lower prices starting at Day 1.
The 2% Market timer and 5% Market timer show the same behavior, but with a bit more distinction. Why? They sometimes stay out of the market for months or years. They might miss a 10% bull increase, and then buy in at the end after a 2% drop. Basic math tells us they’re in trouble. Their money misses out on a net ~8% gain. These are sub-optimal stock market strategies.
Let’s hedge our bets
I heard from many Redditors that my original analysis was too “all or nothing.” One of my investors follows the incredibly simple “normal” technique. The other is all-in on waiting for the markets to drop.
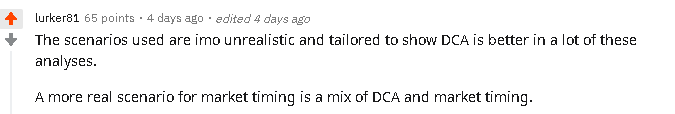
More realistic stock market strategies would combine the two. So here are two stock market strategies where our investor hedges their bets:
- An investor who puts $50 per week into the market (like normal) and puts $50 a week into a “risk free” account and waits for a 10% market dip. We’ll call this “Half and Half.“
- An investor who follows a 10% market dip strategy, but puts a limit on how much cash they’re allowed to hold. At the end of each quarter (every 13 weeks), they take 20% of their “risk-free” account and invest it into the market. They never lose out from years and years of hoarding cash. We’ll call this the “Cash Limit” strategy.
“Normal” investing vs. Hedge Strategies
Once again, we see that any variation that includes market timing strategies performs worse than normal investing. It’s true for every 30-year period in the study.
Hedging between market timing and normal investing yields results that lie between normal results and market timing results. The market timing portion of the strategy always acts as a drag on the performance.
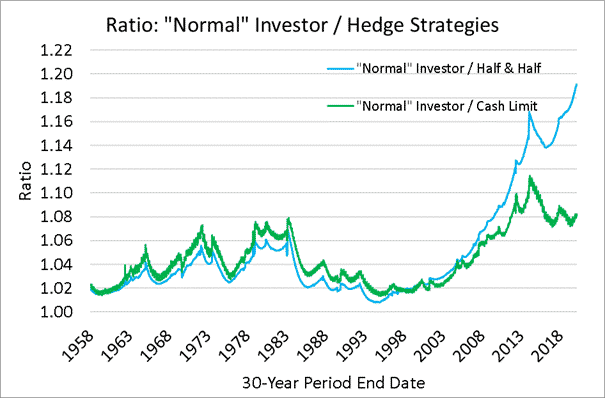
If the “Half & Half” investor switches to 75% normal and 25% market timing, then their results move closer to the normal investor’s results. At 90/10, the results are even better. But the only way to get as good as normal investing is to eliminate market timing altogether.
“Normal” investing vs. Hedge Strategies
The “Lurker” Technique
I named these stock market strategies after Reddit user lurker81, who brought up the fact that many people have cash reserves for non-investing purposes. For example, the emergency fund! Why not consider using them? While I would not recommend that anyone dip into their emergency fund to buy stocks, lurker81 was asking for the sake of science: what if you did use emergency funds to buy low?
What are the rules? This strategy applies the normal investor’s $100 per week baseline. But if there’s a market dip of 10%, our investor pulls an additional $900 out of his emergency fund to make a one-time $1000 investment. Over the following 9 weeks, our investor uses his $100 per week to refill his emergency fund. Very disciplined! And that way, the two methods are always investing the same principal, just at slightly different rates.
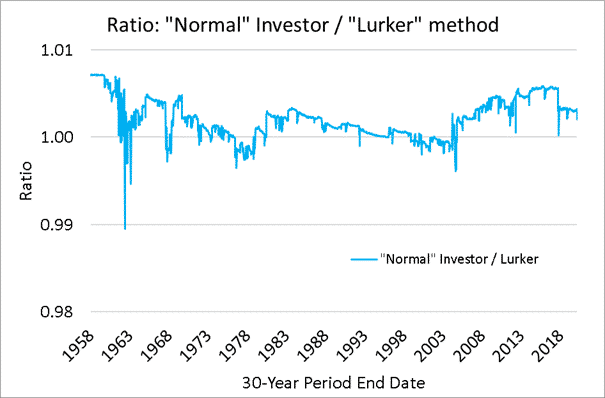
“Normal” investing vs. “Lurker” strategy
First, we can clearly see that the Lurker method is, at its core, highly correlated to normal investing. These two stock market strategies never vary by more than 1%.
Second, I see that the Lurker method has plenty of success. There are many times in the past century when the Lurker method was preferred.
But I was surprised that the Lurker method wasn’t better for the majority of the time. If we’re putting $1000 into the market ahead of schedule, shouldn’t that whole “time in the market” schtick work in our favor?
I have a pretty good idea of what’s going on here. And it just so happens that history is providing us a prime case study as we speak.
Why the Lurker method doesn’t always work
Imagine, if you will, that we use daily S&P prices (rather than weekly) to compare the normal method and Lurker method over the recent Coronaviral weeks.
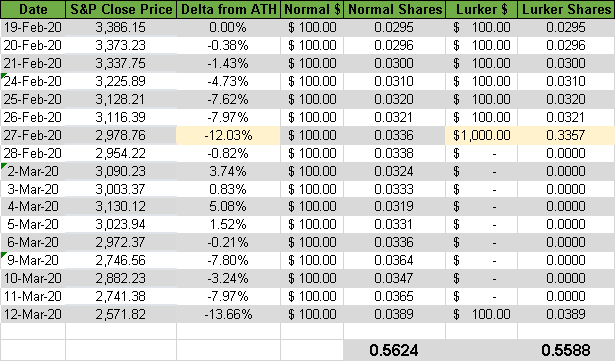
Both investors invest $100 from February 19 (our high water mark) through Feb 26. Then, we see that our Lurker would have made a big purchase on Feb 27, as the market was down >10% from its previous high.
However, the market continued to drop (on average) over the following nine days. So our normal investor ends up buying at better prices while the Lurker refilled their emergency fund. To use another investing colloquialism, the Lurker technique “caught the falling knife.”
When we expand this example out from daily buys to weekly buys, we see the same pattern. The Lurker method tends to pull the trigger too quickly, and the normal investor catches up (and passes) while the Lurker refills his coffers.
Let’s give Lurker some credit
So, for the sake of science, let’s expand Lurker’s credit line. Let’s say they can “borrow” up $5000 from their emergency fund in $1000 increments. That way, they can potentially keep “buying low” as the market falls.
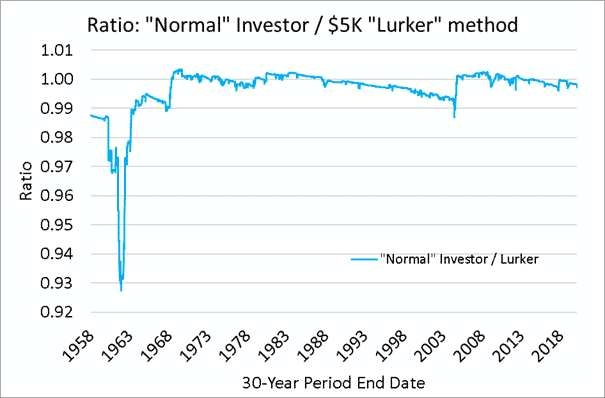
“Normal” investing vs. “Lurker” strategy
Interesting! We see that this expanded Lurker method would have performed very well during the Great Depression, and did better than normal investing for about for the majority of our 30-year periods. This is the result we might expect, similar to the lump sum stock market strategies.
But, there’s a caveat: if you have $5000 lying around that you’re willing to invest, the best thing to do would be to invest it as a lump sum on Day 1. That was the first comparison we did. The Lurker strategy toes the line: “Well, technically it’s my emergency fund or just some extra cash lying around. I don’t want to invest it on Day 1.”
And for the most important caveat, here’s a pop quiz: when are the periods when you’re most likely to need an emergency fund? I’ll bet you a cup of coffee that they’re strongly correlated to how the economy is doing as a whole.
I’m not sure I’d use $5000 of my emergency fund to invest when the world is plummeting into a pandemic. Even in non-pandemic market crashes, lots of people lose their jobs. The cash-on-hand might be very useful in those kind of scenarios!
Are 30-year periods special?
I’ve only looked at 30-year periods thus far. We don’t want to get caught in the trap of results-oriented thinking. So there’s a question begging to be asked: how does the data look over different investing timelines.
In theory, we should be able to answer that question without any plots.
Over short time horizons, volatility can occur. You make a single $100 bet on the roulette wheel and win $3500. You might summarize that roulette is a good investment, or that you’re particularly skilled.
Over long timelines, however, volatility tends to average out and we see that data reverts to the average. If you play roulette a million times, you’ll realize that you are mortal and the house is favored.
Back to investing. If we look at our stock market strategies in 10- or 20-year periods, we’re likely to see more volatility. Higher highs and lower lows. But if we look at 40-year periods, we’re likely to be more convinced of normal investing’s prowess.
And, as if I’m writing these paragraphs having already seen the data, wouldn’t you know that the historical data supports this idea.
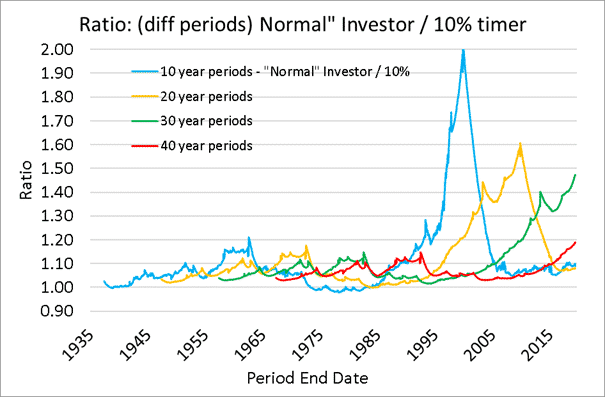
“Normal” investing vs. 10% Market Dip
In some 10-year periods (blue line), normal investing outperformed market timing by more than 100%. But in other periods, market timing was the optimum strategy!
The 20-year periods (yellow) just slip down to the 1.00 mark at times, but spend most of history with normal investing outperforming market timing.
We’ve already looked at the 30-year data (green), and the 40-year data (red) simply provides more support. If you’re investing for the long haul, normal investing has always been more fruitful than market timing. The longer you invest, the more likely that is to be true. It’s the same reason why “the house always wins” in roulette.
What didn’t I cover?
I missed a lot, I’m sure. I know there are potential holes, what if’s?, and entire asset classes outside of these stock market strategies.
I didn’t look at bonds other than my low-risk treasury bonds.
I didn’t look at put and call options. Mainly, that’s because I think they are designed to drag money off of the average investor who uses (or misuses) them. Yes, they provide hedging when you want to lower risk. But like roulette: the more you play, the more likely you are to ending up in a losing position.
I didn’t look at a diversified portfolio of stock indexes, bond indexes, REITs, etc. And that’s the kind of portfolio that I use in my own life! My thought was that it would add complexity to an already-dense article.
I didn’t look at crypto, but I do love to write about it.
I know there are holes in this article. I’m not a professional, nor an academic, nor a fiduciary. I hope you take my results with a grain of salt and use them to compare and contrast against other sources.
And I hope you ask me any questions you might have!
Final thoughts
I’ll be honest. The COVID-19 outbreak makes me nervous. I’m worried about my loved ones, my friends and coworkers and city, and also for our society at large. This will be a testing time, and we could fail in some painful ways.
But I’m not worried about my investing. I’m not considering a sudden change from the stock market strategies that brought me here. And the historical data supports me.
If I had a lump sum of money, I would have thrown it at the market a long time ago. I certainly don’t plan on scrounging up dollars to invest as the market plummets.
I’m going to continue with my normal 401(k) contributions (every two weeks) and Roth IRA contribution (once per month). These regular investments will “buy the dip” on their own, without me taking any extra action. I’m not looking into active stock trading.
Thank you for reading! Here are three quick notes for you:
First – If you enjoyed this article, join 1000’s of subscribers who read Jesse’s free weekly email, where he send you links to the smartest financial content I find online every week. 100% free, unsubscribe anytime.
Second – Jesse’s podcast “Personal Finance for Long-Term Investors” has grown ~10x over the past couple years, now helping ~10,000 people per month. Tune in and check it out.
Last – Jesse works full-time for a fiduciary wealth management firm in Upstate NY. Jesse and his colleagues help families solve the expensive problems he writes and podcasts about. Schedule a free call with Jesse to see if you’re a good fit for his practice.
We’ll talk to you soon!
-Jesse
Very interesting and educative, the numbers don’t lie. Thanks for this!
Hi Dave, thanks for reading. The market can be scary, but you got it right: the numbers don’t lie.
Pingback: Weekend Reading: Stock Market Roller Coaster Edition - Financial Freedom
Hey Jesse! Great work here and I’ve shared it with my Facebook followers this excellent analysis to help calm the nerves surrounding this market drop due to COVID-19.
I’d like to request you add another case, out of my curiosity. What if the investor receives an annual bonus every year that is equivalent to 6 months worth of his/her regular savings/investment? Let’s assume that this person receive that predictably every 12 months (in addition to the regular salary.)
This is currently the situation myself and some of my readers are in. There are a few scenarios I’d like to see if you are willing to add it:
1. Should I dump all of it in right when I receive the funds?
2. Should I DCA the amount: over next 3 months, 6 months, 9 months or 12 months?
3. Or maybe because I know that I’ll receive this with some certainty some time before the bonus, I can start the DCA earlier: 1/3 of the bonus a month before (using part of emergency fund to advance the investment), 1/3 on the day I receive it, and 1/3 a month after I receive the funds.
I’d be curious which case works best here.
Given that I just myself received a large annual bonus in the middle of this market turmoil, I’d like to see what the best strategy would be in a crisis situation like this as well.
Again, great work!
Hi Lion! I’m glad you’ve found it useful, and thanks for sharing!
To me, it sounds like your scenario is a linear combination of “Normal” investing and Annual Lump Sum.
Therefore, between your Option 1 and Option 2, the historical data would support Option 1.
Re: Option 3…spending money before you have it is always a debatable topic 🙂
If you’re sure it’s coming, then the historical data would support investing earlier.
But “counting your chickens before they hatch” is always a risky behavior.
Things are changing around the globe so quickly right now. I’m not sure I’d suggest that anyone borrow from their emergency fund in order to invest.
Again, thanks for reading and asking these questions. Hope this helped!
-Jesse
Pingback: Corona stories from Backpack Finance - Backpack Finance
Pingback: A Lot Can Change in Ten Years - The Best Interest - Long Term Thinking
Pingback: What's Next? - The Best Interest - Future steps, one day at a time
Pingback: A Modest Student Loan Proposal - The Best Interest
Pingback: The Worst Financial Advice of 2020 - Building Self-Reliance
Pingback: The WORST Financial Advice of 2020 - Way Out Of Rat Race
Pingback: Lump Sum vs Dollar Cost Average – Job-99.com
Pingback: Buy Low Sell High - Investment Advice that Works? - Partners in Fire