Let’s look at net worth targets by age. Mean, median, and various percentiles.
How much money should you have as you age? How should your average net worth grow? Digest the 25th, 50th (i.e. median net worth), and 75th percentile data below.
Apologies to my international readers—most of this data is pulled from or targeted towards U.S. readers. I suggest you use Numbeo to scale these values to your locality.
Let’s get started!
The Good Stuff—Average Net Worth By Age
You didn’t come here to scroll to the end of the article to see the average net worth targets. Let’s get to the good stuff!
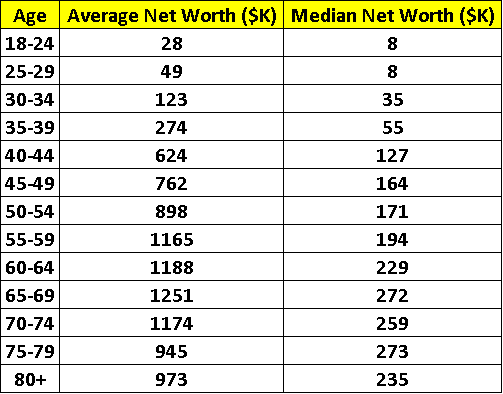
Note: units = thousands of $USD
Note: If you have some money but you’re unsure what to do with it, use the financial order of operations.
And here are five expert viewpoints of average net worth targets by age. This initial plot is the 50th percentile, or median, net worth.

Where are these net worth targets by age coming from?
Enjoying this article? Subscribe below to get new articles emailed straight to your inbox
Fidelity
First, I pulled from Fidelity. Their recommendations are all relative to salary (e.g. “3x your salary by age 40”). I used the median American salary by age to convert salary targets into average net worth targets by age.
Note: Fidelity defines net worth as retirement savings only, and does not count other assets (e.g. your primary home’s value). The other methods below do include other assets beyond your retirement savings.
DQYDJ
Next, I pulled data from DQYDJ. DQYDJ originally pulled of their data from the Federal Reserve Board’s Survey of Consumer Finances (labeled “The Fed” on the plot).
This Fed data is from 2019. This is the same net worth targets by age data in the table above.
This DQYDJ/Fed data is real data. It’s not a hypothetical target or subjective goal. In my charts today, you’ll see three sets of “subjective targets” and only one set of “real data.”
The Balance
Next, the financial aggregation site The Balance follows a similar formula to Fidelity. At particular ages, they say, your average net worth should aim for an ever-growing multiple of your salary.
Financial Samurai
The Financial Samurai, a.k.a. Sam, is a long-time financial blogger with a no-nonsense attitude about saving money. Sam’s lofty targets are for, he says, people who:
- Take action rather than complain about an unfair system
- Max out their 401k and IRA every year
- Save an additional 20% or more after taxes and 401k/IRA contribution
- Take calculated risks through investments in various asset classes
- Build multiple streams of active and passive income
- Work on a side hustle before or after their day job
- Focus on the big picture and don’t nitpick with minutiae
- Want to achieve financial freedom sooner with their one and only life
Fair enough, Sam! Sam’s high net worth targets are going to be far above average.
The Best Interest
And finally, I took my own stab at some average net worth targets by age. I did this based on deciles of American salaries, typical milestones in the average American’s life (various debts, children, growing salaries) and the savings rates that might rise and fall as a result of those life events.
- A young couple might be able to save some money—but having children will put a dent in their savings rates.
- As the couple’s salaries rise, savings will increase. But if/when they help their children with college, their savings rates might take another dip.
- While young, one’s investments might be higher risk (and higher reward). But as someone ages, their portfolio is likely to trend towards safer investments.
**Note: I recommend using YNAB to track your progress. You and I both get a free month of YNAB if you end up signing yourself (or someone else) up with the link above. No extra cost to anyone involved. You get a 34-day trial, and then an additional free month. That’s two months to figure out if you like it.
Inflation Multiplier
I also took inflation into account. Net worth targets by age need to be adjusted for inflation.
The average 30-year old today might be making $40,000 per year. But the average 60-year old today was making $25,000 per year back in 1990 (i.e. when they were age 30). What are the consequences?
While the average 60-year old today might hope to have an average net worth of $800K (Best Interest opinion), that’s not what a current 30-year old should treat as their target or goal.
If we assume 2.5% annual inflation for the next 30 years (leading to a 2.10x total inflation increase), then a 30-year old today should target $800K * 2.10 = $1.68 million by the time they are 60.
Here are some approximate inflation multipliers based on the number of years you want to project into the future. For example, someone age 50 would want to look 20 years into the future if they want to see what their net worth target for age 70 should be.
| Number of years in future | Inflation multiplier |
| 5 | 1.13 |
| 10 | 1.28 |
| 15 | 1.45 |
| 20 | 1.64 |
| 25 | 1.85 |
| 30 | 2.10 |
| 35 | 2.37 |
| 40 | 2.69 |
| 45 | 3.04 |
Looking at the table above, forecasting 20 years in the future requires an inflation multiplier of about 1.64. Make sure you account for inflation in your net worth targets by age.
Analysis of the Median Net Worth Targets
Let’s take another look at those median net worth targets by age. What conclusions can we draw?
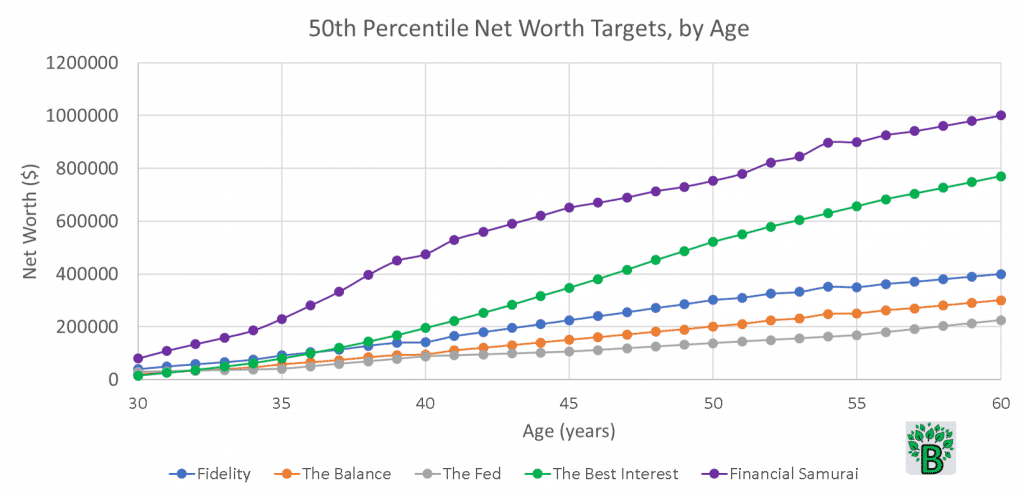
The non-Best Interest/Financial Samurai American net worth target numbers seem low to me.
This is probably an obvious (and biased) conclusion. My method comes up with higher numbers, so I’m going to be biased into thinking the other goals are low.
Let’s start by analyzing this data through the lens of the “4% Rule,” which states that you should take your annual spending and save ~25x that much for retirement.
The Best Interest target ($850K) allows for a retirement income of roughly $34K ($850K/25) per year, or $2800 per month. Financial Samurai’s targets lead to $40000 per year or $3300 per month. When you add in Social Security benefits, that’s a very reasonable allowance for the average American.
The other methods suggest median net worths of $500K, $300K, and $220K, for a monthly allowance of $1660, $1000, and $730, respectively. With the assistance of Social Security, it’s certainly possible to live off these amounts. But there’s more risk involved.
The average Social Security benefit in 2020 is estimated to be about $1500 per month. Let’s add that to the allowances from the previous paragraph.
Would you feel comfortable living off of $3160, $2500, or $2230 per month? Depending on your area of the country, cost of living, medical expenses, retirement goals, etc., it’s a scary question.
What happens if something goes wrong with your plans? Going back to work at age 80 is not an enticing prospect. Neither is asking your children for a handout.
Are these hyperbolic outcomes? I don’t think so.
How to Compare? Apples to Apples?
Does it make sense to set the same average net worth targets by age for both a teacher and a doctor? We know that their net worths targets by age will be dramatically different.
The average American doctor’s gross income in 2019 was more than $300K. Meanwhile, the average teacher’s salary was $60K. Of course, there are millions of people that will fall within and without this range. Does it make sense to compare average net worth targets when incomes are so different?
In my opinion, yes it does make sense to do this comparison. But it’s only one data point that you should use—not an end-all-be-all.
It’s just like a young track athlete comparing their race times to record holders. Of course, they’ll be slower than the record holders. But it gives them a target, an understanding of the gap, a percentage difference to track their progress against.
Besides, the comparisons I presented above are median net worth calculations. They account for the highs and the lows, and they let you know where the middle of that scale lands. Some people start from nothing and build net worth. Others benefit from large generational wealth transfer. This average net worth analysis does not discern between the two.
If you’re making a lower salary but you love to be frugal, then set your targets high! Aim for a high net worth that’s a decile or two above your salary decile.
If you’re fresh out of law school, you’ll probably be in a mountain of debt. You might be low on the scale now, but your long-term financial prospects are good.
Keep circumstances like that in mind as you review today’s charts. This is where age, work experience, education level, etc can all play important roles.
Location and Cost of Living
We’ve covered how inflation and income can affect your position in the average net worth plots. But we should also discuss how your cost of living can affect these results.
Life in San Francisco or New York City costs more than life in Rochester, NY. And life in Rochester costs more than life in rural Kansas. Rent, gas, groceries—all these commodities have different prices around the country.
Therefore, the average net worth benchmarks should change with location.
Use the crowd-sourced site Numbeo to do some of these comparisons. For example, here are some results comparing Rochester to Boston—where Numbeo suggests we need 50% more spending in Boston than in Rochester to maintain similar standards of living.
Numbeo uses New York City as a baseline, giving it an indexed score of 100. The United States as a whole has an index score of 56, suggesting that the average American has a cost of living that’s about 44% less than the average NYC resident.
Look up your city or region to compare it to the United States index score of 56. The percentage difference will give you another way to interpret the average net worth results.
For example, Philadelphia has an index of 62, which is 10% higher than 56. If a Philly resident is using today’s data for retirement planning, they should consider adding 10% to all of the data points.
75th Percentile Net Worth Targets by Age
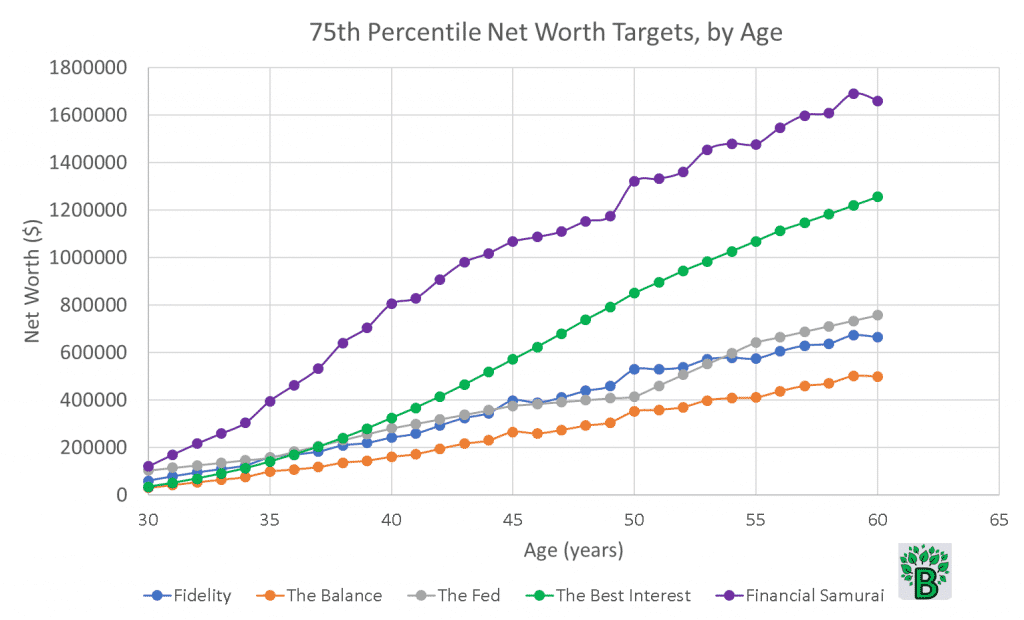
The plot above shows the same five experts’ opinions, but at the 75th percentile.
One interesting aspect of the 75th percentile net worth targets is that the Fidelity recommendation lines up well with the Fed data.
This suggests that people who earn more also save a larger proportion of their income, and people who save more are more likely to meet Fidelity’s thresholds. That’s real data lining up with Fidelity’s subjective targets.
These people have higher average gross income. They have a high net worth. They likely utilize a retirement savings plan. Or they might be the secret millionaire next door.
If we go back to the average net worth chart, we notice that the Fed data lags behind both Fidelity’s targets and the Balance’s targets. In other words: average real-world saving does not meet the average expectations of Fidelity and the Balance.
It takes above-average earning and saving to meet the Fidelity and Balance targets. This is an important point.
It’s not ideal, but it’s reality.
In general, systems that require above-average effort in order to obtain average goals (e.g. to meet suggested average net worth thresholds for retirement) are bad systems.
A good system would only require an average effort to achieve average results. But this is where the Stockdale Paradox is important. Don’t find yourself ten years in the future having not taken action today.
25th Percentile Net Worth Targets by Age
And to make matters worse, check out the 25th percentile chart below.

Here, three of the subjective net worth targets are all in family. Fidelity and my Best Interest targets line up very closely to each other, with the Balance falling 20-30% lower.
But how does the real net worth data compare? At retirement age, real people’s net worths are only 15% to 25% of where they “should” be.
It’d be nice to reach Financial Samurai’s targets, but many people do not have the means to maximize their savings accounts to the extent he recommends.
Let’s put a face to this data. It’s 25th percentile, meaning that one out of four people in the U.S. falls on or below this graph. Dunbar’s Number suggests that the average human can comfortably maintain 150 meaningful relationships–which would suggest that you (yes, you) closely know ~40 people (on average) on or below the 25th percentile plot.
Real people, real lives, real worry. For a 60-year old, to retire on a $50K net worth (or less) is likely impossible to do. On DQYDJ, I looked at the 25th percentile net worth for 70 year olds—it’s $56,000.
25th percentile net worth is meager all the way to the end of life. That’s a sobering fact.
The Wealth Divide
What might be causing this household net worth disparity? How do people have negative net worth, or lower-than-needed net worth?
Rising expenses and wage stagnation is an easy cause to point to. The lack of financial education hurts. So does poor financial health—like having a low credit score and paying high interest rates. Student loan debt and credit card debt suck.
Some people are behind from the start. Your first net worth out of college is likely to be negative. Many people wake up 10 years later and find their net worth hasn’t grown. That’s the python-squeeze nature of debt.
Wealthier college graduates don’t have to battle that python. It’s not their fault—that’s just how it is. Without that student loan debt, their average net worth increases rapidly.
After 10 years of work, they’re likely to be debt-free. They’re likely to own real estate. They’re more likely to be collecting passive income or contributing to their retirement account. What do all these activities have in common? They all increase net worth!
Sure, annual salary matters. Total household net worth is a function of salary—just ask the Federal Reserve.
But the net worth divide we’ve seen today starts at the beginning of people’s careers and often never closes. It’s there at age 30, age 40, age 50, age 60.
Why Do Net Worth Targets by Age Matter?
I’m just another personal finance writer, but I think average net worth benchmarks are an important metric of financial health.
Your current net worth isn’t make or break, but it let’s you know how you compare to your age group. Age 30 millennials should think about their financial future. Age 60 retirees should be aware of their cash, stocks, bonds, mutual funds, etc.
Personal net worth is like your blood pressure. It’s a good metric of health.
If you’re behind, you need to take action. While something like wealth transfer inheritances usually helps, you probably shouldn’t rely on one. Instead, increase your savings rate. Utilize your 401(k) i.e. pretax income.
Your financial future will grow from your financial present.
What Counts as Net Worth? And What Doesn’t?
Let’s do some housekeeping. What actually counts towards net worth? The answer is subjective, but it comes down to assets minus liabilities.
In general, I considered the following as contributors to net worth (i.e. liquid net worth contributors).
- Bank accounts
- Retirement accounts (401k, IRAs, etc)
- Investments (stocks, bonds, REITs, etc)
- Other saving vehicles (e.g. Health Savings Accounts, 529 college savings plans)
- Equity in real estate (e.g. your home value)
- Common debts—mortgage debt, credit card debt, average student loan debt, etc. These all count as liabilities that count against you net worth.
- Pension and social security
Note: Fidelity’s targets were based solely on retirement account funds.
And what doesn’t count towards net worth?
- The value of common possessions (e.g. a car, a computer)
- Illiquid or non-transferrable assets (e.g. airline miles)
And what is a maybe? These are assets that are fairly subjective and up to you.
- Collectibles, jewelry, art—how liquid are they? And are you sure you’d want to sell them?
- Business ownership—again, how liquid is it? If you can sell shares, that’s good. But if you own a gas station, is that part of your net worth?
- Accrued annual vacation days or PTO, unless transferable to cash at future date.
- Future inheritance. Probably ok to count if you’re sure you know what you’ll be inheriting.
- Life insurance policies. Does it count as net worth if it only comes true after you die?
Today’s values account for a single person. The average American family’s net worth is likely ~double what we’ve presented today. I.e. average household net worth = 2x average individual net worth.
How to Calculate the Value of a Pension or Social Security
This involves a little bit of math. First, I’ll ask you to come up with four important numbers. Then I’ll show you two important equations. And then we’re going to work through an example together.
The four important numbers are:
- [N] The number of years you estimate you’ll be retired. If you’re retiring at 60, a safe number to use here would be 25 (assuming you live to the above-average age of 85) [ 85 – 60 = 25 ]
- [M] The number of years until you retire. I’m currently 30. If I retire at 60, then the number I’ll use here is 30. [ 60 – 30 = 30 ]
- [R] The rate of return of the pension plan or Social Security. Here are some good sources for pension plan historic data and SS historic data. If you want to be safe, use less than 6% for a pension or less than 5% for Social Security.
- [P] The assumed annual payment once you retire. For Social Security, here’s a convenient calculator. For pensions, each specific fund will likely have its own rules. Example: a typical pension pay-out might be equal to 50% of a worker’s average salary during their final three years of work.
Equations for Pension/Social Security Value at Retirement and Discounted Current Value
The two important equations are:
Fund Value at Retirement = P * [(1 – (1+R)^(-N)]/R
…we’ll call this Fund Value at Retirement the FV. Next, we need to take the FV and discount it backwards to today’s Present Value, or the PV.
Present Value = FV/[(1+R)^M]
Example: Calculating the Present Value of a Pension Fund
Wallace is a 35-year old teacher. He’ll likely retire at 60. And he’s going to be conservative in estimating that he’ll live to 82.
We now know that N = 82 – 60 = 22 and that M = 60 – 35 = 25.
Being conservative again, Wallace is going to use R = 7% as the fund’s rate of return.
And finally, Wallace knows that his pension will pay him 55% of his final year’s salary. He’s currently making $55,000 and assumes he’ll get a 2% raise for each of the next 25 years. His final year salary, therefore, will be about $90,000. And 55% of $90,000 is $49,500 per year = P.
We now know N, M, R, and P. Let’s plug them into our equations. I like to use Microsoft Excel to help keep track of my values and (if needed) easily change them to adjust my final values.
Future Value = FV = P * [(1 – (1+R)^(-N)]/R = $49500 * [(1 – (1+7%)^(-22)]/7%
FV = $547,531
Present Value = PV = FV/[(1+R)^M] = $547,531/[(1+7%)^25]
PV = $100,882
So, if Wallace wanted to include his pension value in his current net worth calculation, he’d use $100,882.
Retiring for Today
We’re at the 95th percentile for this article. I hope the average net worth comparisons today did not steal your joy, but instead opened your eyes to the wide gradient of net worth targets by age in the U.S.
Net worth targets by age are not an extrinsic competition. They’re intrinsic: will I be able to set up my loved ones and myself for fulfillment today, tomorrow, and for the rest of our lives? At least that’s how I think of it.
Looking at net worth percentile data simply helps gauge whether you’re on track, making progress, or need to change behavior. It’s important to realize—ideally at a younger age—that many people in this country are struggling against themselves in their intrinsic race. I hope today’s post might help you avoid that struggle.
Thank you for reading! If you enjoyed this article, join 8000+ subscribers who read my 2-minute weekly email, where I send you links to the smartest financial content I find online every week.
-Jesse
Want to learn more about The Best Interest’s back story? Read here.
Looking for a great personal finance book, podcast, or other recommendation? Check out my favorites.
Was this post worth sharing? Click the buttons below to share!
Pingback: Personal Finance Unknowns - The Best Interest - It's what you don't know...
Pingback: Index Fund Bubble: Arguments For and Against - The Best Interest
Pingback: Jeff Bezos and the Meritocracy Kings - The Best Interest
Pingback: How to Put the "Personal" in Personal Finance - Money Saved Is Money Earned
editor’s note – Bob’s comment influenced a change in the article. Thanks Bob!
Jesse,
Why would you not include the future value of a pension into net worth??? It is an asset due to you, at a predetermined age (time). Couldn’t we approximate its value as the expected annual payment/ 0.04 (pesky 4% rule again) to postulate its “future lump sum”. At the very least, your contributions should be considered as a means of forced savings for those not prudent enough to plan for their future.
-A federal employee
Bob – you make a great point. In fact, I thought about your question quite a bit last night and decided, “Bob’s right!”
I just edited the article to include a section whereby the reader can easily calculate the future value of their pension plan or Social Security disbursements. Then they can discount those future values back to today. The Present Value can then be used in their net worth calculations.
Pingback: Here is Your Ultimate Guide to 2 Player Card Games - Bella Wanana
Most people not at or near retirement don’t realize Social Security has such a wide range of value depending on your work history. In my case I paid the max possible amount into Social Security for every one of the 35 years required to get the maximum benefit. That means my wife and I will receive $66k when we start taking it at age 70. If we took it now we’d still receive $55,000 a year. That’s enough for a pretty comfortable retirement by itself.
That’s awesome, Steve! Yeah, Social Security certainly has the capability to be a great safety net or addendum to your retirement funds.
I think a bunch of people my age have concerns about Social Security’s long-term outlook. Will it still be around, be funded, and have the same age requirements as it does currently? Important questions, and tough answers to predict.
Pingback: Net Worth: What It Is and Why It Matters - Money Saved Is Money Earned
Pingback: Ultimate Guide to 2 Player Card Games - The FRUGAL TOURIST
Pingback: How to Stop Spending Money You Don't Have - The Female Professional
Pingback: Investing 1,000 Dollars a Month Made Easy — Cash for Kat | Investing
Pingback: Mental Shortcuts to Solve Your Money, Work, and Social Problems • Parent Portfolio
Pingback: 5 Growth Mindset Habits for Building Wealth • Parent Portfolio
Pingback: Net Worth 101: What is Net Worth and How to Calculate it - Savology
I am 37. I only make 53,000 a year. Yet, my net worth is 475k without owning a home. How? I lived at home for 4 years in my late 20s to save money. While I lived there, I opened up my first trading account and off I went. It also helps that I made a profit of 80k last month by selling 5 bitcoins. I also do not (and do not want) to have kids. So, that obviously saves me a bundle. I do not include a future inheritance in my calculation for one simple reason: It’s not guranteed that I would outlive my dad even though he’s 40 years older than me. If I did include it, my total net worth would be around 1.1 million dollars.
Hi Shaun. Great work. Keep plugging away. And don’t forget to budget some money for taxes on that BTC sale 😉
Thanks for commenting. All the best.
-Jesse
I definitely have set aside triple what I’d owe if at the end of the year I had a 80k short term capital gain.
Hey Jesse, thanks for the great blog! I was curious why did you include one’s home value as well as debt as contributors to net wealth? Shouldn’t they all be considered as liabilities? Thanks again!
Hey! Thanks for the great question.
My two cents – your home is an asset you own. It’s up to you whether to count it as net worth or not.
Debts are all liabilities that should count against your net worth. I just went in and edited a couple sentences in the article to make that more clear 🙂
-Jesse
Pingback: How To Put the “Personal” in Personal Finance – Karpiak Caravan