Don’t miss an episode of our podcast, Personal Finance for Long-Term Investors. Available on all podcast players.
Here’s the latest episode:
Mr. Money Mustache (MMM) might be the “Paul the Apostle” of the financial independence / FIRE movement, a relentless missionary spreading the Lord’s word far and wide. If MMM hasn’t converted more people to FIRE than anyone else, he’s got to be near the top of the list.

Perhaps his most famous sermon is The Shockingly Simple Math Behind Early Retirement. I can attest – it steered me down a path that led me to where I am today. Hallelujah.
MMM is great. Thank you, MMM.
But with an audience of…millions?…there is a big responsibility to share accurate advice.
Lest I blaspheme, I think his recent work is dead wrong.
False Profit
MMM recently wrote a post called, The Shockingly Simple Math Behind Social Security.
While the article has a few different subtle points, the main thrust is that taking Social Security at age 62 is better than at any other age because, in short, stock index funds grow faster than Social Security benefit increases.
…Am I really telling you that it’s actually less valuable to work longer so you can get the higher [Social Security] benefits? The answer is yes, for people who understand the concepts of “investing” and “the time value of money.
To really understand this, just imagine what would happen if you started taking those payments as early as possible (age 62) and tossed them into an index fund, earning 6% after inflation on average. After the first year, you’d already have about $24,300 and you’d still be piling in that extra two grand per month and the whole snowball would be starting to compound.
By the time your more patient friends started drawing $2796 payments five years later, you’d already have over $137,000. It’s such a big lead that the 67-year-old will never catch up.
MMM is but the latest victim of a fatal logical flaw in Social Security analysis.
“They Repeat Their Folly”
In MMM’s defense, he’s far from the first and won’t be the last person to make this mistake.
What mistake?
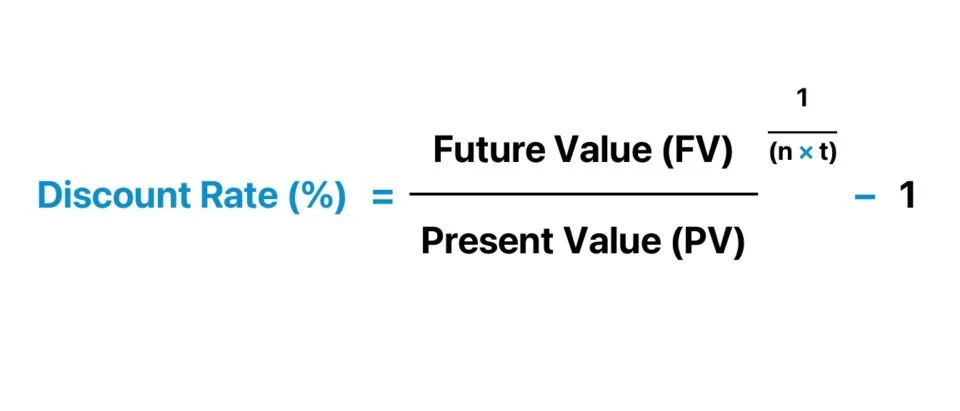
The discount rate.
Discount rates help us compare present values to future values (or past values). Warren Buffett would say that discount rates started with Aesop – a bird in the hand is worth two in the bush.
MMM’s discount rate is flawed. It’s that line where he says, “…earning 6% after inflation on average.” He’s actually using ~9%, because the 6% is inflation-adjusted (6% + 3% for inflation = 9% nominal index fund returns).
“But Jesse! Stock index funds DO earn something like 9% per year over long periods of time!”
That’s correct. But it’s incorrect to use that as your discount rate here.
Why?
Because when choosing a discount rate, it’s important to match the risk of the cash flows. In simple terms, that means our discount rate must reflect the “risk” built into Social Security. A common phrase in discount rate discussions is “your next best option of similar risk.”
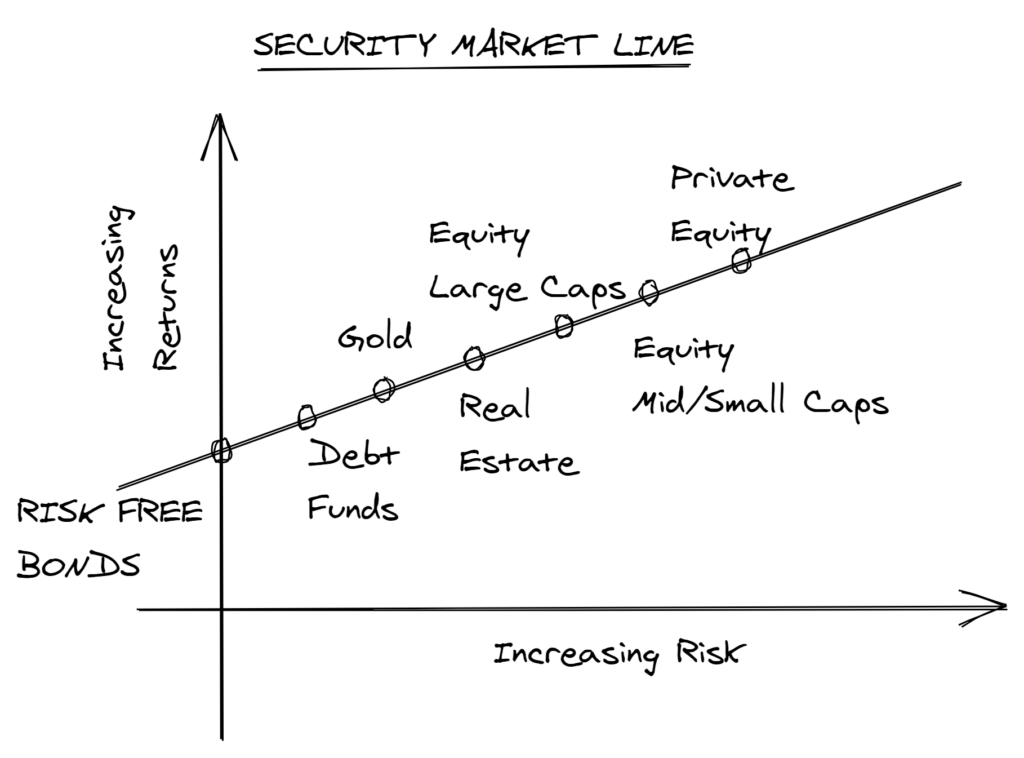
Does the risk of the stock market reflect the risk of Social Security? No.
The Social Security increases you earn by delaying your benefits are guaranteed by the full faith and credit of the U.S. government. That’s as “risk-free” as it gets. Stock index funds (which I own a ton of!) do not come close to meeting that high bar.
After all, why not use a 20% discount rate? That’s Berkshire Hathaway’s annualized return for the past 70 years.
Or a discount rate of 230%? That’s Bitcoin’s annualized return since inception.
It’s because those comparisons clearly are not apples-to-apples with Social Security. We recognize that on its face. Using stock market returns might be less egregious, but it suffers the same flaw.
What Discount Rate Makes Sense Instead?
How do we correct this error? What discount rate makes sense instead?
Let’s go back to thinking about the risk of the cash flows. Or our next best option of similar risk.
Social Security behaves like a government-guaranteed annuity, with inflation-protection built in.
The “next best option of similar risk” here would be TIPS (Treasury Inflation-Protected Securities). And the current TIPS yield curve ranges from 1% to 2.5%. That is a real, inflation-adjusted return.
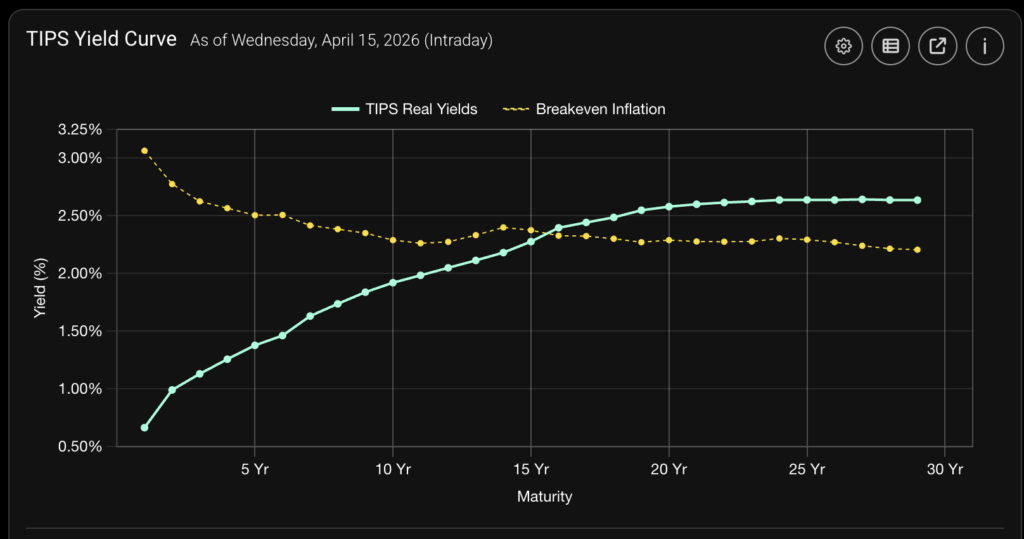
Where MMM uses 6%, the right answer is ~2%.
MMM’s calculations come to this conclusion:
[…showing that collecting at 62 has the greatest net present value, aka is the best]
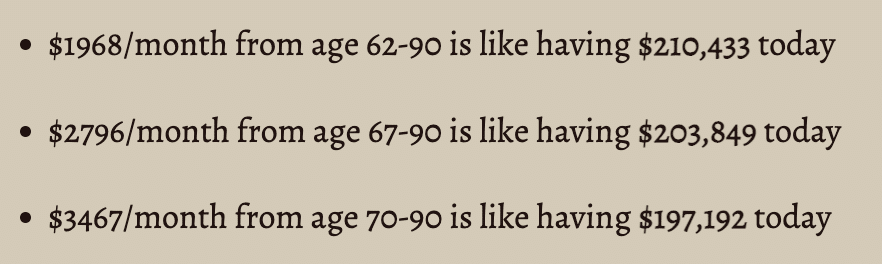
But using more accurate inputs (a 2% inflation-adjusted discount rate, a la TIPS), the actual numbers are:
- $1968/month from age 62-90 is like having $506,000 today
- $2796/month from age 67-90 is like having $618,000 today
- $3467/month from age 70-90 is like having $685,000 today
If you live to age 90, delaying Social Security until 70 is optimal, even if you discount future cash flows.
The “shockingly simple math of Social Security” is shockingly wrong.
PS – if you really want to learn more about Social Security, read these:
- When Should I Take Social Security?
- Should You Take Social Security Early and Invest It?
- Spouses, Survivors, and Exes: Your Relationships Affect Social Security
- Should the Higher-Earning Spouse Delay Social Security?
Thank you for reading! Here are three quick notes for you:
First – If you enjoyed this article, join 1000’s of subscribers who read Jesse’s free weekly email, where he send you links to the smartest financial content I find online every week. 100% free, unsubscribe anytime.
Second – Jesse’s podcast “Personal Finance for Long-Term Investors” has grown ~10x over the past couple years, now helping ~10,000 people per month. Tune in and check it out.
Last – Jesse works full-time for a fiduciary wealth management firm in Upstate NY. Jesse and his colleagues help families solve the expensive problems he writes and podcasts about. Schedule a free call with Jesse to see if you’re a good fit for his practice.
We’ll talk to you soon!
Great post, I ALSO clash with the “take it at 62” crowd.
I CRINGE when I hear “you never know when you’re going to pass” or “you only live once (retirees taking SS at 62 said it LONG before any millennial lol).
Don’t get me wrong, there ARE times when it makes sense to take SS earlier than the MAX age of 70. Most of the reasons revolve around health, family health history, and/or being the lower-earning spouse who ALSO makes less than 23k-ish a year in taxable income.
There COULD be one additional reason to take it at 62, but it is SO nuanced, it just wouldn’t apply to many people. Someone could claim benefits at 62 and treat the income stream like a payout from an annuity, so they draw less from their stocks/higher risk equity, so they COULD KNOWINGLY take on MORE RISK while they are still young (ish) / healthy (ish), enough to work part-time IF those risky investments tank. Catch all that lol? Oh…AND they have to earn under 23k-ish in earned income, or some or all of the benefits will be held back lol. This would need to be a very pro-risk, older person in good health, expecting a long life ahead, who has a darn good reason to take on much more risk for some limited upside. Personally, I don’t want my investments keeping me awake at night when I am 62.
The above scenario COULD ALSO be valid IF markets tank STEEPLY early in retirement and you do not have the health to work a little part-time or the ability to cut back spending much more. The theory here is to leave AS MUCH stock/equity alone for AS LONG as possible, so that it has more time and chance to bounce back. I would NEVER do this for a 10-30% correction. For this to MAYBE even be considered, I would expect a 1929, 2000, or 2008 level crash. Fast and steep. AND on top of that, the person considering should have little other options to live off (aka not more than a couple years or non-equity investments like bonds, alts, and cash), they can’t cut back spending by much, and working a little part-time to reduce our drawdown is not an option.
OTHERWISE…there are some other small perks and benefits to waiting to take SS….wait as long as you can (assuming a normal life expectancy).
1.) Most states, including New York, don’t tax Social Security benefits. But they do tax your distributions from a traditional 401(k) or IRA. So, I would rather have more state-tax-free income if given the choice.
2.) Only 85% of your SS is taxed at the federal level. Hey… every dollar adds up, and saving on taxes is extra sweet to me lol.
3.) Social security is likely more reliable than most annuities and pensions.
4.) Simpler for non-financially savvy spouses. I not only want as much income for my wife in retirement, after I am gone, but I want it to be simple for her. She has 0 interest in tracking basis, optimizing RMDs, tax-efficient withdrawal strategies, or complex legacy planning for the kids’ tax optimizations. That is MY wheelhouse, and I want to do as much of it while I am around.
Instead….well optimize to the point to get max ACA benefits until we are 65 (using a mix of traditional and Roth funds), I’ll take SS at 65 (as the lower earning spouse and am OK taking on a little more risk to not take at 62…unless I have health issues….cross that bridge then)….draw down AS MUCH traditional funds as possible while we are filing taxes jointly, then at 65, claim SS when we switch to medicare/medigap. Those extra 3 years of waiting for me (the lower-earning spouse) will allow me to draw down my taxable retirement accounts, while I KNOW we are filing jointly and have a much higher standard deviation/bottom 2 tax brackets. At 65, we will make some conversions so we do not tip into the second bracket (while leaving SOME money in our traditional 401k to offset future standard deductions and the limits of the lowest 2 brackets). Did I lose you?….yep…lost my wife too lol. That is why I want her to have as high a VERY SIMPLE social security payment as possible. It gives HER COMFORT.
5.) As the lower-earning spouse…the longer I wait…the more my wife will get (for a short period) monthly until she claims her MAX SS benefit at 70. Could we have had a little more LIFETIME value had I taken it at 62 vs. 65 and passing early…100%…but her getting a slightly bigger monthly check for a little while helps the string just a little lol. She values BOTH money…and simplicity. I value optimization and money lol.
6.) Sleep. At age 62….MAYBE my spouse or I could… in theory… be a greeter at Walmart, bag groceries at Whole Foods, consult part-time, work the ticket desks at a theatre, or whatever jobs seniors can secure years out. Or we could roll the dice and buy a lower-tier health plan for a couple of years, or forgo some travel and spend more time gardening or hiking. So if s*** hit the fan, we have SOME options. But, if I (we as a couple), take SS at 62…..and DOWN THE ROAD….after we are 70 or older….markets tank…..I have WAY fewer options. I may be too old for many of the jobs listed above. i may not be in a position to buy a cheaper health care plan, or it may cause some preexisting conditions to be reevaluated (depending on what state / political climate we are in then). While I LOVE retirement planning and know many retirees….I have not yet lived 100% on passive income… the idea of having less control over what markets do and the options I have to adjust… is scary and stressful. I would sleep SO much better knowing SS covers 40-60%+ (30% for 2 people, 60% for one, even after the lower SS payment stops) of all our NEEDS at age 70 than taking it at 62, having the market fall, and wondering how we are going to swing our elder years.
Moral of this EXTREMELY long post…the longer you wait…the simpler your income becomes, the lower your future taxes, and the better everyone sleeps lol.
This is *your* blog post, just waiting to happen, Will! All good points and good reminders of the nuance of this decision.
I’m not the financial whiz of many in this crowd. That said:
MMM hopes for a 6% real return for his monies taking SS at 62. SS goes up 8% real for every year of deferral.
The stock market has sequence of returns risk for those 8 years. SS has no sequence of returns risk.
The 6% gains MMM hopes for are subject to taxation. The 8% SS increases are tax invisible from 62-70.
Hoped for gains cannot be compared with guaranteed gains.
This is my personal stance as well, Christopher. I see it as a “no brainer,” less any known health reasons to claim early.
If you *think* you’ll have an average lifespan (or longer), then I see delaying as 100% the correct move.
I’m not the financial whiz of many in this crowd. That said:
MMM hopes for a 6% real return for his monies taking SS at 62. SS goes up 8% real for every year of deferral.
The stock market has sequence of returns risk for those 8 years. SS has no sequence of returns risk.
The 6% gains MMM hopes for are subject to taxation. The 8% SS increases are tax invisible from 62-70.
Hoped for gains cannot be compared with guaranteed gains.
I get all the financial arguments saying wait, but a key non financial SocSec question is, would you rather have an extra dollar to spend when you are younger (healthier and more active), than a dollar when you are in your late 80s and 90s?
My thoughts exactly!!
That’s a fair question. Perhaps the answer is to bake in a “life opportunity cost” into the discount rate itself.
That said – the OTHER way to think about it is that *all money is fungible.*
So if you want the “extra dollar” while you’re 62, the answer is to pull that extra dollar from your portfolio. Then, you can replace that dollar later using the higher SS benefit.
You still have “the extra dollar”. You are pulling more from your retirement account early, KNOWING you’ll have a larger SS payment later to make up for a smaller retirement account balance.
Call it RADR (risk adjusted discount rate) and attribute it to me ?
You heard it here first!
Every day past 62 that you’re dead, you don’t collect a cent from SS!
No, but your spouse might be, and would have a higher income if SS was deferred.
Pepper Man! Good to hear from you. My thoughts – if you have a married couple, then there’s a powerful reason for *at least* one of the spouses (typically the higher earner) to delay to age 70. Survivor benefits are very impactful, and there’s a 75% chance those benefits will live beyond the break-even age.
100% true that every day past 62 that you are dead, you do not collect….BUT your spouse may collect survivor benefits until he/she hits 70 and will get something.
If there is no spouse….every day you are dead past 62…who cares? You no longer have any risks to manage or mitigate. Your heirs might have a little more cash. I guess that is nice, but will they care if they get a little more? They will likely just miss you, and any additional amount you get would be nice, but not at all life-changing. And that assumes your heirs do sensible things with your money lol….not always true.
This is the clearest explanation of why the discount rate matters that I have read anywhere. The point about matching the risk of the cash flows is so often glossed over, and seeing it applied to the Social Security question really makes it click. I had been carrying around the same flawed intuition from the FIRE community for years, so this genuinely changed how I think about the trade-off between guaranteed benefit increases and market returns. The Berkshire and Bitcoin examples were a great way to show how absurd an arbitrary discount rate becomes. Appreciate the willingness to push back on a popular idea with actual rigor. Bookmarked this one to revisit before my next retirement planning conversation.