This post was originally published in April 2021.
Current 1-year stock market returns look amazing. Who would choose any alternative investing strategy when their current method has granted them 40%, 50%, or higher 1-year returns?
Of course, there’s more here than meets the eye. And we need to zoom out to see it.
Amazing 1-Year Returns
Here’s a snapshot of the S&P 500 1-year return, as of April 7, 2021. It’s up 53.2% compared to last April. We are flying!
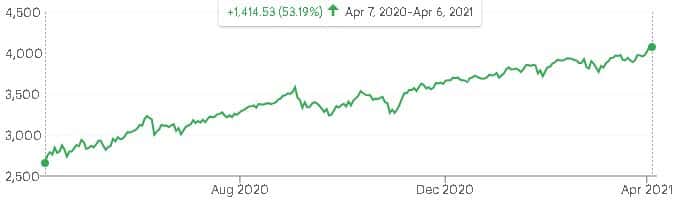
Hot damn! This return has amazing ramifications on stock portfolios. We’re normally told to assume that stocks will return ~7% per year (on average) after adjusting for inflation. This past year was seven times better than that.
Once we start compounding, the 53% return becomes even more amazing. Five years of compounded 53% return outperforms 30 years of 7% returns.
A few more years of this and we’ll all be retiring. Right? Right?!
Sad to say, the other shoe must drop. We’re missing something important.
One Year Is Never Enough
More data provides more clarity; one year does not make a long-term investing data set. One year is never enough.
When starting from a market bottom, the resulting returns are going to look phenomenal. That’s exactly what we’re doing here, starting from the COVID shock crash.
It’s like analyzing an athlete’s year-over-year performance the season after he broke his leg. Of course he’s going to look better this year. His leg isn’t broken anymore!
April 2021’s 1-year return is especially egregious.
The stock market had a broken leg last April. COVID fear had traders flocking for the exit door, willing to accept lower prices as long as it meant they could liquidate their positions. To see why current 1-year returns constitute chart crimes, we simply need to zoom out a tiny bit.
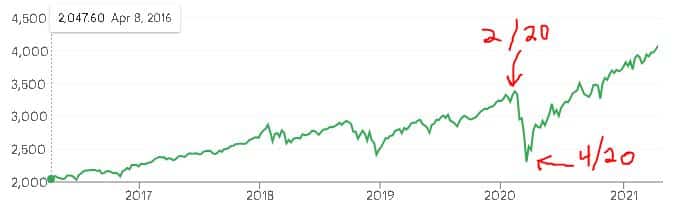
See that 4/20 red arrow?! See how the market had a broken leg last April?!
You don’t see that broken leg in the first graph today, the one that only showed 52 weeks. We have to zoom out to see that dip. We have to be willing to absorb more data.
If we look at a 60-week return (starting last February), the stock market is up 22%. That’s still very good! But it’s not 53%.
Let’s zoom out further to the full 5-year return in the chart above. The market is up 99% since April 2016, or the equivalent of five consecutive compounded 14.8% 1-year returns. Again, that’s very good. But it’s significantly different than a 53% 1-year return.
If we keep zooming out, we get closer and closer to “truth.” Here’s the S&P 500 dating back to 1928, plotted on a log scale.
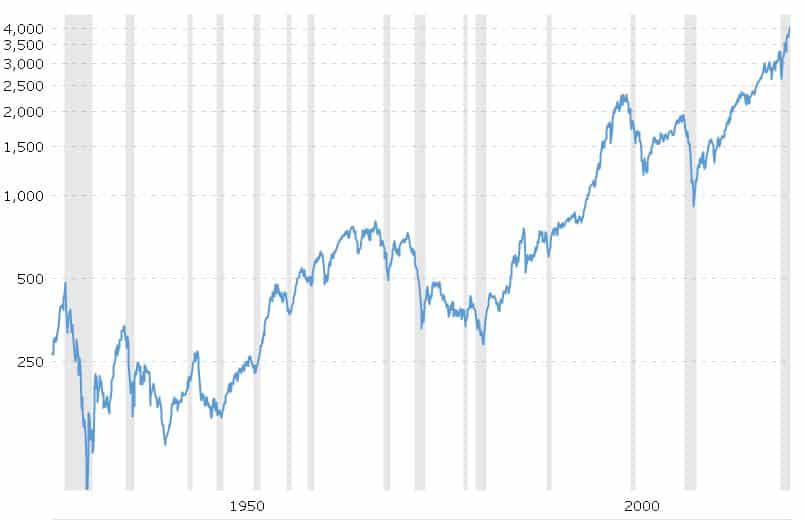
After adjusting for inflation (which is smart) and assuming dividends get re-invested (also smart), we conclude that the S&P 500 has historically returned ~7% per year.
You can pat yourself on the back for a 53% return if you want to. But be careful. Healing from a broken leg simply means you don’t have to limp for the rest of your life. That’s different than learning to fly.
We All Need to Zoom Out
That’s all I have to say on stocks for today. You can be happy that markets have recovered from last spring, but bragging about 1-year returns right now is foolish.
In parallel “zoom out” news…humans are notoriously bad at zooming out to long-term thinking. It’s one of my favorite pet topics. Here are a few good reads on that idea:
- A Lot Can Change in 10 Years
- The Market Crash is Coming!…Eventually
- 7 of My Money Mistakes…and the Lessons Learned
- 31 Lessons from 31 Years
That’s it. Short and sweet.
Thank you for reading! Here are three quick notes for you:
First – If you enjoyed this article, join 1000’s of subscribers who read Jesse’s free weekly email, where he send you links to the smartest financial content I find online every week. 100% free, unsubscribe anytime.
Second – Jesse’s podcast “Personal Finance for Long-Term Investors” has grown ~10x over the past couple years, now helping ~10,000 people per month. Tune in and check it out.
Last – Jesse works full-time for a fiduciary wealth management firm in Upstate NY. Jesse and his colleagues help families solve the expensive problems he writes and podcasts about. Schedule a free call with Jesse to see if you’re a good fit for his practice.
We’ll talk to you soon!
Spot on about needing to zoom out in life in general. I always try to look at the bigger picture, but it’s not always the easiest to do. In the daily grind, you forget that growth is slow and steady. It is painful some days, but that is growth. Be in it for the long haul.
Hey AR, thanks for the nice note! Totally agree with you. It’s tough to judge a tree’s growth on a day-by-day basis.
Great post. It will be interesting to see where the S&P 500 will be in a year from now. How much inflation will we have and what will the interest rates rise to.
Thanks Brian!
Zooming out on returns to put things in perspective. This is always a good idea in the good times and bad times. I agree with AR it not the easiest thing to do in the “daily grind” like many things in life you can get tunnel vision and forget to Zoom out to see the big picture.
Tech! Good to hear from you again. I like you perspective…it’s useful in the good times and the bad times.
Reminds me of the late Tony Hseih’s simple quote…”Things are never as bad or as good as they seem.”
FAST FWD 2 YEARS; looks like the S&P flattened out holding around 4,550 since this was posted, and it’s been quite a ride along the way, especially in the tech sector. But, as they say, one year doesn’t necessarily “make a trend”. Predicting the next 18 months, especially with AI in the mix, is a challenge, but staying informed is key.
Hey Jonnie. The “wild ride” part is spot on. The stock market has been anything but flat.
My two cents…don’t try to predict the next 18 months, either. If you have money needs in the next 18 months, that money shouldn’t be invested in stocks.
Instead, the money you have invested in stocks should be earmarked for needs 10+ years in the future.