I never want this to happen to you.
Michael Lewis – the author of Moneyball, The Big Short, The Blind Side, etc – has a terrific podcast called Against the Rules. In a recent episode, Lewis and famous baseball statistician Bill James were discussing the “Moneyball revolution” in baseball, and they concluded:
Numbers start out as tools for thinking. They wind up replacing thought.
Michael Lewis
Baseball is a finite game of discrete outcomes. Pitches. Strikes. Hits. Runs. Easy to witness, easy to measure, easy to report on. While an emphasis on statistical optimization has led to more winning, Lewis and James believe the emphasis has gone too far. An overemphasis on statistics leads to poor conclusions and poor decisions. Statistics can become a crutch that atrophies our critical thought.
The same is true – and typically worse – in other professional fields. When numbers replace critical thought, bad outcomes abound. It certainly happens in investing.
I never want that to happen to you (or me). It’s one of the reasons I write here.
The timing of that podcast and Lewis’s quote was perfect for me. Last Friday, I taught personal finance and investing to two groups of ~40 total teachers at Wayne High School, just east of Rochester.

One of the lessons in my presentation is a quick reminder of compound interest. Start early, invest often, and let time work for you. On that particular slide, one of the teachers asked a fantastic question:
“You talk about 7% returns per year…but the market isn’t that consistent, right?”
Exactly! What an amazing question.
Because one of the scariest things I hear from amateur investors is:
I’m just gonna throw this money in the stock market for a couple years, get my 20% return, then buy that house.
Timmy, 23, took an economics course at State
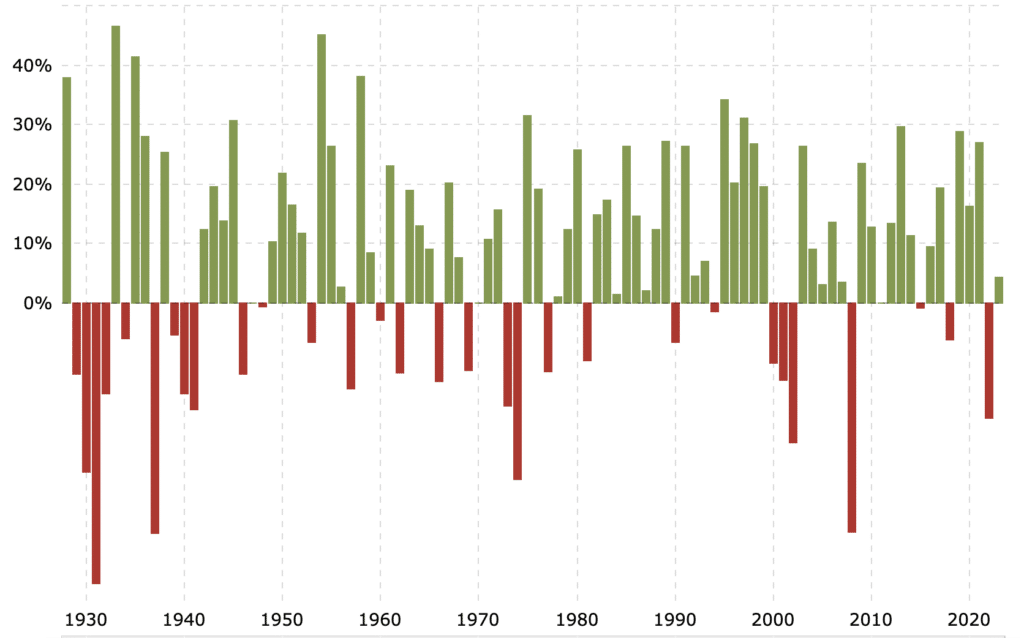
The stock market’s annual variance is huge, as low as -50% and high as +50% in a single year. Whenever anyone quotes a 7% – 10% stock market average, they’re zooming out to 20+ year periods. Stocks are not a short-term, <10 year investment.
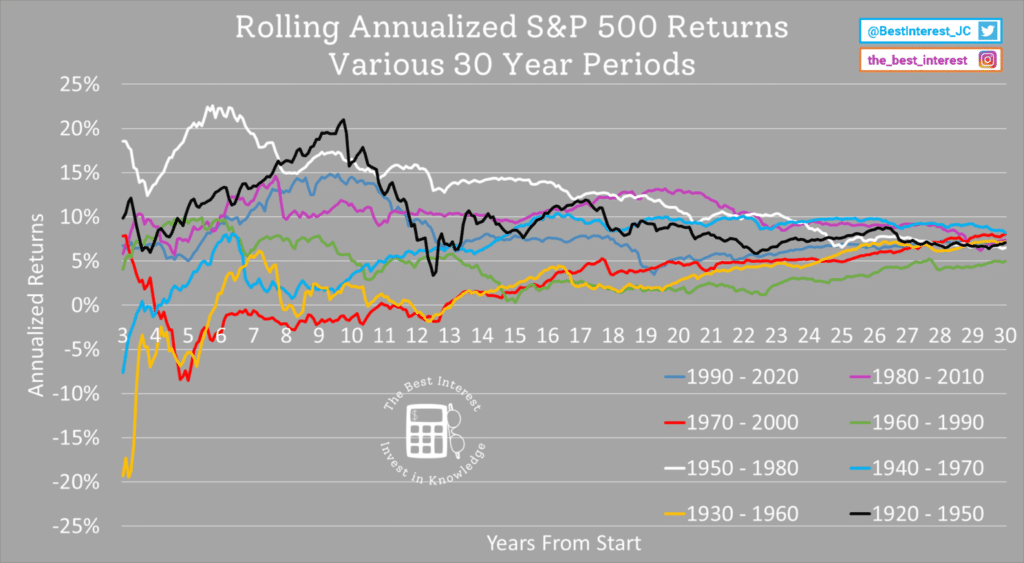
The following chart is one of my favorites (and from one of my favorite articles). It shows how an investor’s annualized returns would have changed over various 30-year investing periods.

Do you see a line showing a flat, 7% per year average? No way! Instead, the returns are over the place. Up, down, in between. Yet, over the long run, the data exhibit one of my favorite investing topics: reversion to the mean.
Yes, eventually, the returns converge on a 6-8% annualized, inflation-adjusted return. That’s why many investing professionals use the 7% annual average. But some pros (and many more amateurs) forget to mention (or realize) it takes 2+ decades (bumpy decades at that) to achieve that average.
The 7% average helps us think about investing. But we can’t let that stat replace all thought. It’s important to understand where the 7% figure comes from. It comes from decades of staying the course, especially during tough markets.
I wrote a few weeks ago about great investors’ little secret. It’s not brains. It’s temperament. And it takes a unique temperament to simultaneously hold the following thoughts in your head:
- The stock market grows at 7% per year, on average, after adjusting for inflation.
- But it could return anywhere from -50% to +50% in a given year.
- And those first two statements are based on historical precedent, which we all admit is far from an iron rule. In fact, for all we know, historical precedent could fundamentally shatter tomorrow.
Do I use history as my guide? Absolutely.
But is history an absolute guide? Absolutely not.

In another episode of Against the Rules, Michael Lewis interviewed James Spann, an Alabama meteorologist who has dedicated his professional life to minimizing preventable deaths from tornadoes.
What do tornadoes have to do with baseball and investing? Quite a bit.
Weather forecasting – like all forecasting – is an exercise of probabilities.
A 70% chance of rain is not a guarantee. It’s a probabilistic statement. If a 70% chance of rain leads to a dry day, you shouldn’t be surprised! It happens about 30% of the time. That’s a hard truth for many people to understand. But if you want to be a good investor, it’s vital you understand it. Improbable things happen all the time.
Probabilities are easier to understand in terms of playing cards. I have a deck of 10 cards. 7 black, 3 red. The chance of pulling a black card is 70%. But if I pull a red card, would you be surprised? Surely not. It’s completely realistic.
Investing is the same. History gives us data and we use that data to apply probabilities to the future. 7% per year is a useful heuristic. The longer you invest in stocks, the more probable your long-term annualized returns have approached 6-8% per year.
But it’s never guaranteed. The shorter you invest, the less probable the outcome.
Check out the green line in the multi-color chart. After ~23 years, that investor had still only achieved ~1.5% annualized returns, or about a 41% total return. Yuck! It’s not a probable outcome. But it’s possible.
[Meanwhile, the white, blue, and purple investors had all achieved ~10% annualized returns after 23 years. A 900% total return, more than 20x better than the green investor]
Numbers are an amazing tool for thinking. Vital, even. But they need context, lest they wind up replacing thought.
Thank you for reading! Here are three quick notes for you:
First – If you enjoyed this article, join 1000’s of subscribers who read Jesse’s free weekly email, where he send you links to the smartest financial content I find online every week. 100% free, unsubscribe anytime.
Second – Jesse’s podcast “Personal Finance for Long-Term Investors” has grown ~10x over the past couple years, now helping ~10,000 people per month. Tune in and check it out.
Last – Jesse works full-time for a fiduciary wealth management firm in Upstate NY. Jesse and his colleagues help families solve the expensive problems he writes and podcasts about. Schedule a free call with Jesse to see if you’re a good fit for his practice.
We’ll talk to you soon!