What return can you expect from the American stock market? Most sources cite:
- 10% per year nominal growth, on average
- After accounting for inflation, your spending power (or “real returns”) ends up around 6.5% per year
This is based on the past ~100 years of S&P 500 performance. Of course, actual returns are disturbingly different than average returns. I recommend you click that link if you’re unsure what I mean.
But today, I want to ask a different question: what about taxes?
Tax-Free, Tax-Deferred, and Taxable
There are three types of tax treatments in American investment accounts.
- Tax-free accounts have no long-term tax burden. Typically that’s because income taxes have already been paid before the investment deposits. Roth accounts are one example.
- Tax-deferred accounts are, as the name implies, a way to defer taxes to the future. Traditional 401(k) accounts are one example. You pay no income tax today, invest in a 401(k), and pay income taxes upon your future 401(k) withdrawals.
- Taxable accounts are the “third leg” of the retirement stool. They provide none of the tax benefits outlined above but are significantly more time-flexible. Most tax-free and tax-deferred accounts have age restrictions associated with their use. No so with taxable accounts. As for the taxes: the money going into taxable accounts has already suffered income tax, and funds in the account will be subject to both dividend taxes and capital gains taxes.
With these “extra” taxes (dividend taxes and capital gains taxes) in taxable accounts, how are investment returns affected? How much do the 10% per year nominal returns decrease?
Results
To answer the question, I downloaded dividend tax rate and capital gains tax rate histories, as well as Robert Shiller’s S&P 500 data set.
I looked at data from 1950 until today (a good post-WWII date, providing 72 years of data), dividing the period into 700+ rolling 10-year periods. Ex: March 1954 to February 1964 is one period.
I looked at each period as a modern investor might—as an opportunity to dollar-cost average into the market, buying an even $100 of the S&P 500 every month.
For each period, I asked:
- What’s the nominal, tax-free stock market return?
- …now if we include dividend taxes (every month, as various dividends are paid) and capital gains taxes (a lump sum at the end of the 10 years), how much do returns decrease?
- …and finally, how does inflation decrease the spending power of these returns?
On average, each of these 10-year periods saw a total compounded return of 170%, or a compound average return of 10.4% per year. This does not include any deleterious effects from taxes or inflation. We get a result similar to the textbook shorthand of 10% per year. Nice!
A tax-deferred account (Traditional 401(k)) would see the same returns, except for a big bite from income taxes upon final withdrawal. If someone is paying 22% marginal Federal income taxes, their 170% total return would decrease to 133%. Their annual growth decreases from 10.4% to 8.8% per year.
Some of you, though, will max out your 401(k) and IRA, and the next-smartest option is a simple taxable brokerage. In that case, dividend taxes will trim your profits every month. And capital gains taxes cause a big haircut upon final withdrawal. How has this tax drag affected historical returns?
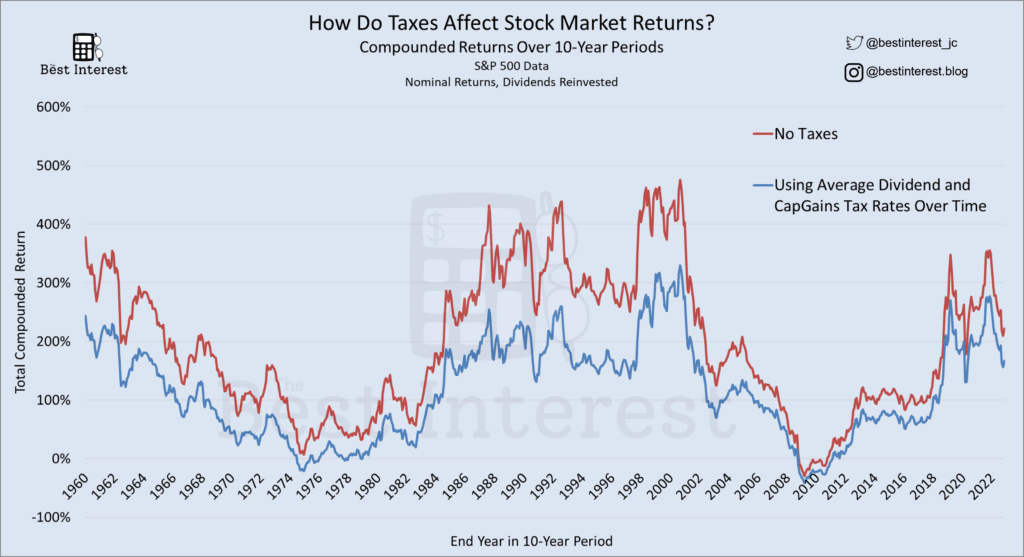
On average, each 10-year period since 1950 saw a total compounded return of 100% (vs. 170% previously), or a compound annual rate of 7.2% per year (vs. 10.4% previously). In other words, taxes decrease total stock returns by ~41% overall (from a total return of 170% down to 100%).
Here are the results, shown as compounded returns over 10 years.
Here’s the same data as above, but showed as annual returns.

But we still need to adjust for inflation to see “real” returns. Real returns, in other words, measure how much did my actual spending power change? Inflation equally affects tax-free, tax-deferred, and taxable accounts (because all three accounts measure growth in terms of dollars – and inflation affects every dollar the same).
The average real return of this data set in a tax-free account (e.g. Roth) is 6.8% per year, or a total 10-year real return of 93%.
In a Traditional 401(k), the average real return is 5.2% per year, or a total 10-year real return of 66%.
And the average real return in a taxable account is 3.6% per year, or a total 10-year return of 42%.
Increasing your purchasing power by 42% is better than a kick in the pants…but a 3.6% annualized return is a far cry from the pre-tax, pre-inflation assumption of 10% per year. It’s easy to plan retirement if your real spending power increases by 10% yearly. It’s much harder at 3.6% per year.
Ok – what’s the point?
The point is that most retirement calculators – especially the quick-and-easy ones on the Internet – do not appropriately account for tax drag. As such, they estimate that investors will increase their spending power by ~6-7% per year. That’s the nominal 10% growth, minus ~3.5% for inflation.
But that’s incomplete! Sure, your Roth and 401(k) assets will grow in a tax-advantaged manner. But for many of us, a significant chunk of our stock portfolios (i.e. in our taxable accounts) will only see real growth of 3-4% per year. And that’s assuming future growth will mimic the past – which is no guarantee.
But Jesse – tax rates have changed over time!
Correct. As previously stated, taxes took an average ~41% bite out of investment profits over the observed 10-year periods since 1950. But recent tax rates have relaxed, with many recent periods seeing “only” 25-35% reductions. I’d argue that’s still a significant drag.
What will the future hold? Taxes are currently historically low. Don’t be surprised if future taxes go up – and post-tax investment returns go down.
So…Roth at 6.8% per year and Traditional at 5.2%…Roth is just better?
Remember: Traditional accounts have a terrific tax benefit up front, before any of the analyses shown today.
If I have identical income tax rates today and at retirement, then the benefit of the Traditional accounts and Roth accounts are identical. That’s just the math.
Roth dollars have higher long-term returns only because they first had to take a tax haircut. Traditional dollars are equal-but-opposite – no haircut up front, but their future taxation affects the investment returns.
So…should I avoid investing in a taxable account?
Remember – a positive real return (like our +3.6% per year result) is better than nothing.
The dollars in your bank account suffered a real return of (-8%) over the past year. That’s a loss. Compared to that, I’ll take +3.6% any day.
The point of this article is not to discourage you from investing in a taxable account. Rather, the point is to correct a common, overly optimistic assumption about investing returns.
If you want shorthand metric to plan your future, I’d recommend using historical averages, but rounded down. Since I’m investing for long periods in a diversified stock portfolio, I use:
- In Roth (“tax free”) accounts, a 6% real return per year.
- In Traditional (“tax deferred”) accounts, a 5% real return per year.
- In taxable accounts, a 3% real return per year.
Thank you for reading! Here are three quick notes for you:
First – If you enjoyed this article, join 1000’s of subscribers who read Jesse’s free weekly email, where he send you links to the smartest financial content I find online every week. 100% free, unsubscribe anytime.
Second – Jesse’s podcast “Personal Finance for Long-Term Investors” has grown ~10x over the past couple years, now helping ~10,000 people per month. Tune in and check it out.
Last – Jesse works full-time for a fiduciary wealth management firm in Upstate NY. Jesse and his colleagues help families solve the expensive problems he writes and podcasts about. Schedule a free call with Jesse to see if you’re a good fit for his practice.
We’ll talk to you soon!
So if I have a mortgage at 6.0% Mathematically I would be better off prioritizing paying that debt down than putting the money in a taxable account right?
Assuming I am already maxing out 401k and IRA of course 😉
Hi Sara. If we’re invoking math, those two options (paying down a 6% mortgage vs. taxable brokerage investment in stocks) would be *roughly* equivalent. Here’s my thinking…
Paying down a 6% mortgage is equivalent to a 6% nominal return.
The taxable brokerage stock investment provided a nominal 7.2% return.
It’s important we remember that nominal and real returns are different, and our comparison here should be apples-to-apples. That’s why I’m using nominal returns for both here.
Now, the 6% nominal return via paying down your mortgage is GUARANTEED. You can be 100% sure that your current extra mortgage payment will save future 6% debt payments. A guarantee is important!
Because with stocks, the 7.2% nominal return is far from guaranteed. It’s only a “best guess” based on past data. The future could be higher or lower. That’s risk.
Would you rather have a guaranteed 6%?
Or a “somewhat likely over the long run but also risky” 7.2%?