Don’t miss an episode of our podcast, Personal Finance for Long-Term Investors. Available on all podcast players.
Here’s the latest episode:
I saw someone post this image on LinkedIn this week.
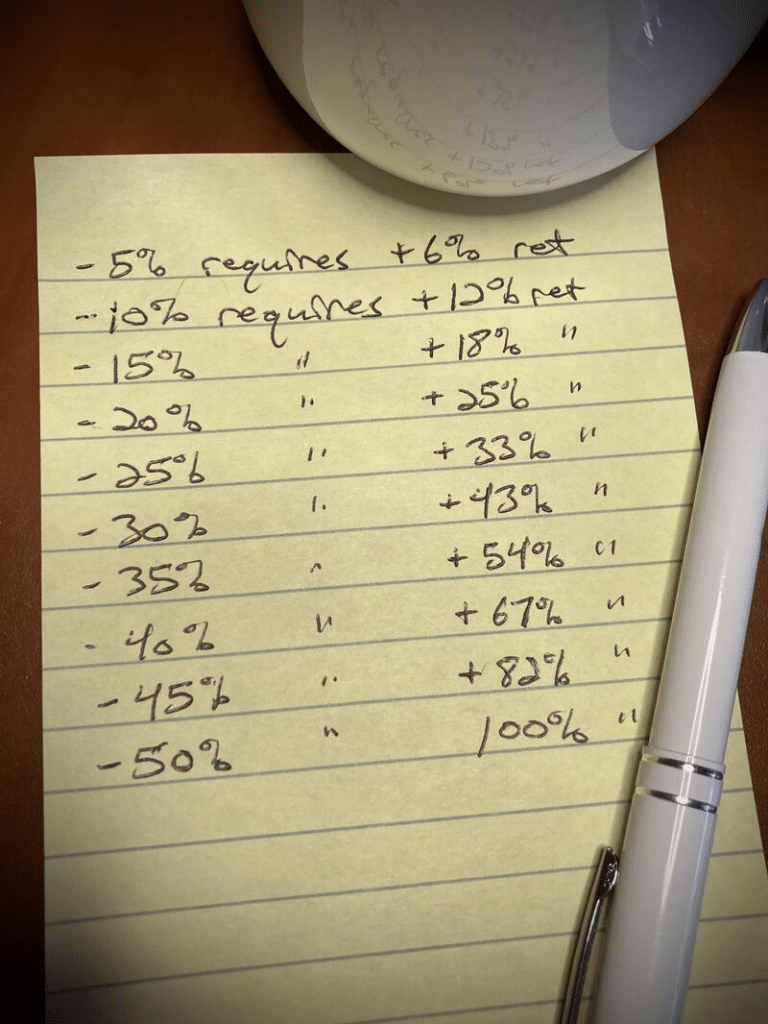
Their commentary on the image is:
You want to risk-manage your hard-earned assets.
Here are some rough estimates on the return you would need (in right) to break even again (regain) after taking a loss (on left). Returning to break-even isn’t a 1-for-1 process.
Risk management is key.
You might have seen something similar before. I know I have. Lots of investment people out there talk about how small percentage declines require big percentage gains to get back to even.
Their takeaway concerns volatility and risk management. They’re claiming that losses are “extra” harmful because they require larger subsequent gains to get back to even. As this particular investor wrote:
“Returning to break-even isn’t a 1-for-1 process.”
In other words, “Be extra fearful of losses, because they ‘count more’ than gains.”
This is flawed logic. We need to stop this line of reasoning. It doesn’t make sense and causes us to be worse investors for it.
I Forgot My Keys…
Imagine I’m walking to the office. It’s about a mile each way. I get within sight of my office building and reach for my keys…oh sh**, I left my keys at home!!

I call home, ask my wife to grab them for me, and she meets me part-way. But still…I need to walk 75% of the way back home to meet her. My progress dropped (-75%). I grab the keys from her (~~thank you!!~~) and turn around toward work.
How do I get back to where I was before? I would now need more than +300% progress to get back to the office.
WOW! 300%! That’s a lot!
You might think that my walk back to the office would be ~4x harder than the walk home. After all, 300% is 4x as much as 75%. It might not appear to be a “1-for-1 process.”
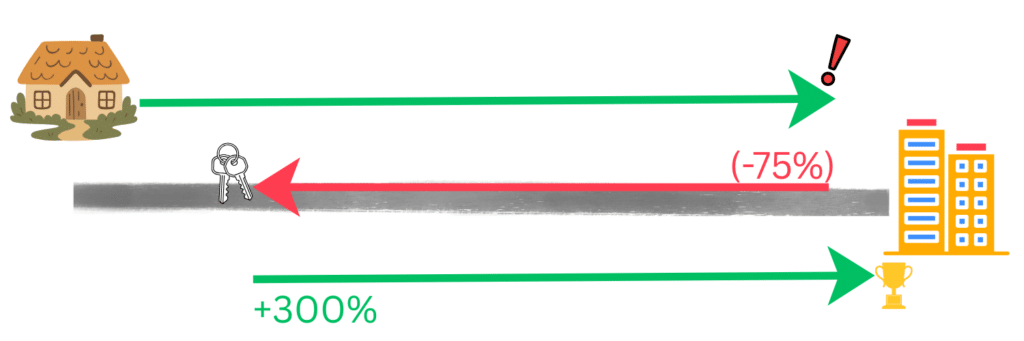
But we all know how to walk down a sidewalk. We can picture going back and forth three-quarters of a mile. It’s the same distance each way! It is a 1-for-1 process, no matter what the percentages say.
When a stock (or the stock market as a whole) has to “go back home” down its own economic pathway, it can just as easily go back up. There is nothing “harder” or “easier” about one direction over the other.
Volatility Drag
This idea is so commonly discussed in the investing world that they gave a proper name to it: volatility drag.
As in:
“The more volatile our year-to-year returns, the less money we actually have. . . . We call this the ‘volatility drag.’ I also like to call it the volatility tax.“
Oh no! Tax! A boogeyman! There’s just one problem.
This is a fundamental misunderstanding of math. When investors talk about “volatility drag,” what they are really saying is:
“The arithmetic average is different than the geometric average.”
That’s it!
Arithmetic? Geometric? You might be saying, “Huh??”
We all know the arithmetic average. It’s the one you’re used to. You add up numbers and divide. The arithmetic mean of 4 and 10 is 7. Add to 14, divide by 2 to get 7.
But the geometric average requires us to multiply and then take the n-th root. Yes, it’s a little more complex. The geometric average of 4 and 10…you multiply (4*10 = 40) and then take the n-th root (two numbers, our N=2, so we take the square root). The square root of 40 is 6.32.
You might notice something. 6.32 is less than 7. The geometric average of 4 and 10 is less than the arithmetic average. This will always be the case. The geometric average will never be greater than the arithmetic average. It’s just the way math works.
Back to investing. Let me ask you this:
What’s the “magic” of compound interest?
Is it about ADDING our investment returns year over year? Or is it about MULTIPLYING our investment returns one on top of the other?
It’s about multiplying! That’s the magic of investing. That’s why we’re here.
So if we’re going to find an “average return over time,” the only way to do so is via the geometric mean. I dove into this topic in detail back in Episode 115 of the podcast. Even glancing at the arithmetic mean is an error. Arithmetic is simpler to calculate, yes, but it’s incorrect to use here.
That leads us to the problem with the entire concept of “volatility drag.” Volatility drag says:
“Whoa! Oh no! Look at how much lower my geometric return is compared to my arithmetic return!”
But I contend there’s nothing to be shocked about. That’s just how the math of investing works. “Volatility drag” is a fancy term to describe the fact that the geometric average is less than the arithmetic average. It has nothing to do with investments or investing in particular, but only with a basic mathematical concept.
Investors created a new word to describe a relatively simple mathematical truism. Why? I think of Charlie Munger’s idea…
“The more models we have, the better able we are to solve problems. But if we don’t have the models, we become the proverbial man with a hammer. To the man with a hammer, everything looks like a nail. If you only have one model, you will fit whatever problem you face to the model you have.”
Someone was missing the model for “arithmetic vs. geometric” and they created an entire new term for it. Yikes.
The Stocks Don’t Know
Stocks don’t know their own price.
Stocks don’t know who owns them.
Stocks don’t know about percentages.
Going back to when I “lost my keys at home,” stocks have no idea “where on the sidewalk” they are right now. And investors shouldn’t care either. If a company’s new earnings report justifies that it’s now worth an additional $10 per share, then its new price should reflect that. It shouldn’t matter whether it’s going up $10 from an old price of $50 (a +20% jump) or $500 (a +2% jump).
Stocks and stock prices simply respond to the economic supply and demand that investors like us place on them. The supply and demand are measured in dollars. Not percentages.
A decrease of $100 is equal-but-opposite to an increase of $100. We can measure those changes as percentages, yes. But those percentages are an afterthought to the dollar changes.
If stock gains were “harder” than stock losses, it would beg the question: why? What is the underlying mechanism that makes gains harder than losses?
(In fact, if you really want to make an argument about the “difficulty” of gains vs. losses over time, I think it would be that gains appear easier to achieve than losses. But that’s not the point I want to make today.)
The stocks don’t know. The prices respond to supply and demand.
Losses and gains aren’t easy or hard, and volatility drag needs to be put to bed.
Thank you for reading! Here are three quick notes for you:
First – If you enjoyed this article, join 1000’s of subscribers who read Jesse’s free weekly email, where he send you links to the smartest financial content I find online every week. 100% free, unsubscribe anytime.
Second – Jesse’s podcast “Personal Finance for Long-Term Investors” has grown ~10x over the past couple years, now helping ~10,000 people per month. Tune in and check it out.
Last – Jesse works full-time for a fiduciary wealth management firm in Upstate NY. Jesse and his colleagues help families solve the expensive problems he writes and podcasts about. Schedule a free call with Jesse to see if you’re a good fit for his practice.
We’ll talk to you soon!
Jesse: Once again, you have hit a home run for me. I have not bought into the significance of the idiosyncratic “math” supposedly describing how more difficult it is to recover from a downdraft. You have resonated with my discomfort by explaining it beautifully.
Kudos once again on your work, your mind, and your passion!
Doug Propp MD
Thank you, Doug
Thank you, Doug!