Don’t miss an episode of our podcast, Personal Finance for Long-Term Investors. Available on all podcast players.
Here’s the latest episode:
Reader Bryan reached out to me today and asked:
I’m sure the recent market is fairly normal in the historical context, but could you illustrate just how normal it is (to make me feel better?!)
Bryan is referring to the fact that the S&P 500 is down about 9% in the last 6 weeks.
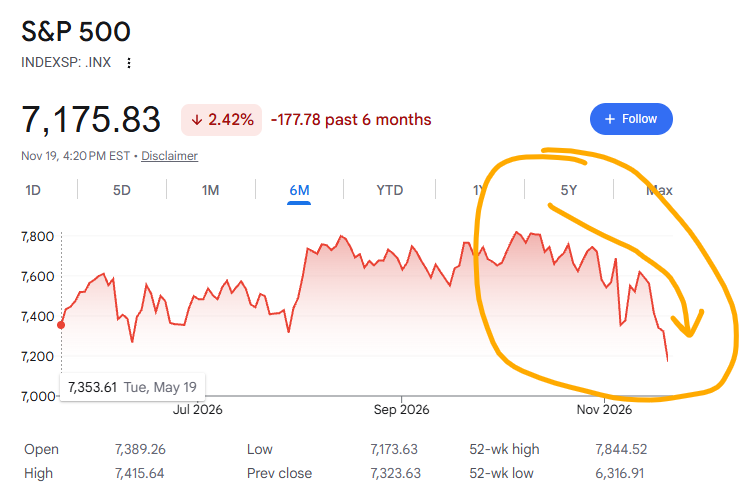
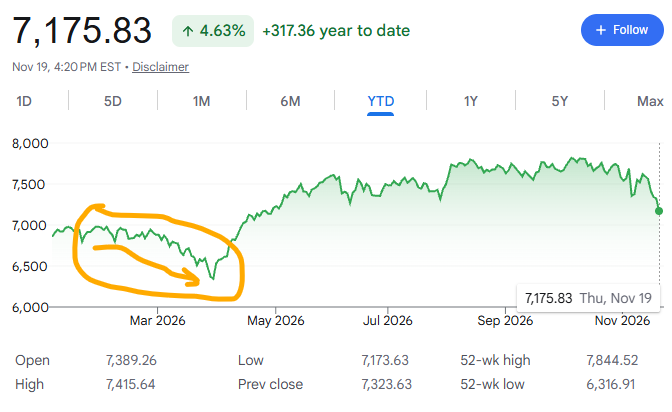
Though it’s worth pointing out that the S&P is still up about 5% on the year (not even including dividends).
And I think it’s also interesting to point out that the S&P 500 had another intra-year drawdown of about 9% back in February – April, mainly due to the Iran War.
But the question remains, how normal is it to have markets like this when viewed through historical context?
I have good news: it’s pretty dang normal!
Let’s delve deep into the annals of history, back to the year…2025.
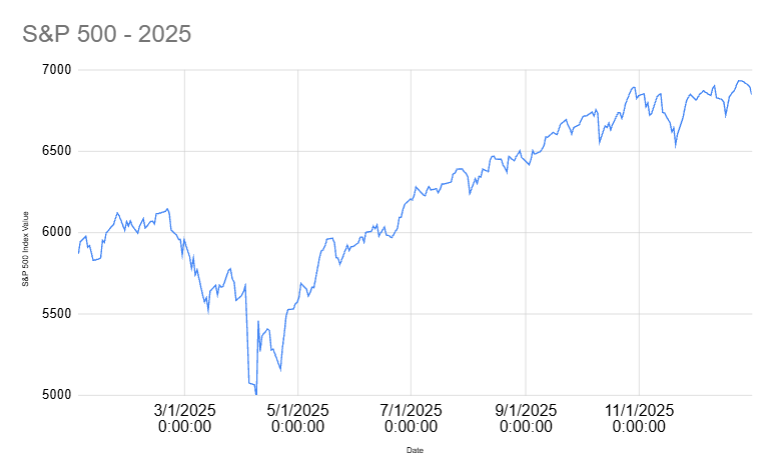
Remember the tariff tantrum? Back in the spring of 2025? The S&P 500 peak-to-trough was (-18%). Yikes.
Don’t fret too much. The market finished the year up 16.6% from where it started (not including dividends).
What about 2024?
The market dropped (-9%) that summer. It also finished up 24% on the year.
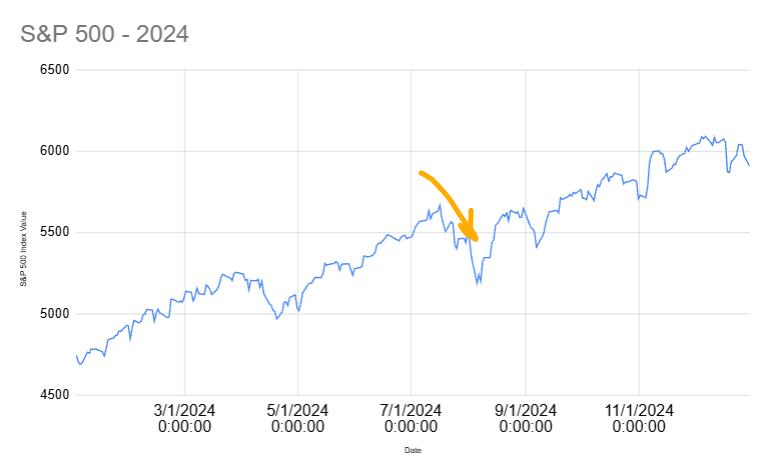
The deeper you look, the more normal it becomes. Most years have significant intra-year drawdowns. It’s part of being a long-term investor.
This famous chart from JP Morgan Asset Management illustrates the idea beautifully.
The gray bars shows where the S&P 500 finished on the year. But the red dots show the largest intra-year drawdown.
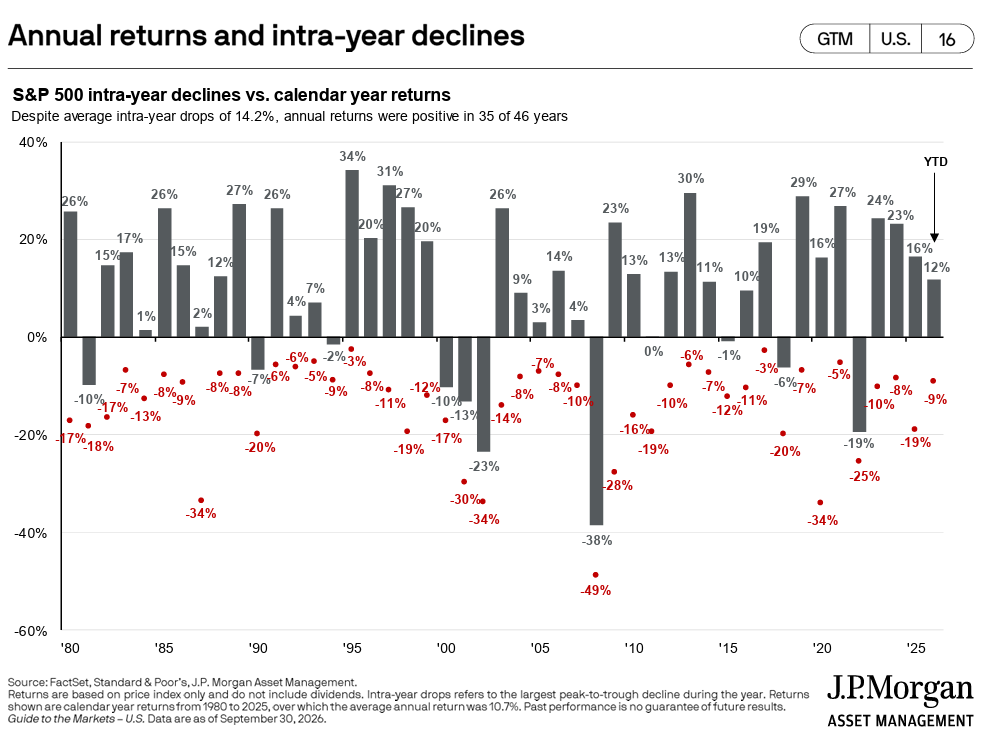
I’m amazed by the number of years that had a 10% or higher drawdown (and lots of sad feelings, I’m sure), yet finish the year not only up, but up double digits.
Sure, we all remember the weirdness of 2020 with COVID. At one point, the S&P was down 34%. Yet it finished the year up 16%. But lots of years worked that way!
2016: down 11% at one point, finished the year up 10%.
2012: down 10% at one point, finished the year up 13%.
2011: down 16% at one point, finished the year up 13%.
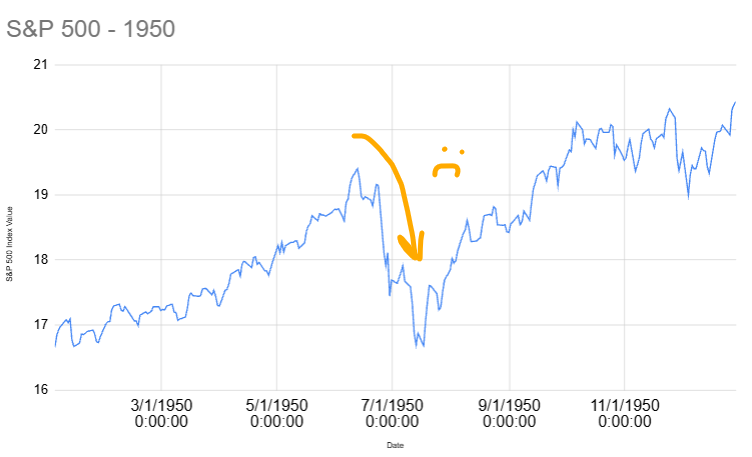
It’s not a new phenomenon either. Here’s the S&P 500 back in 1950, trading at…17. It fell (-14%) during the year. It finished the year up 22%.
Here’s the entire decade of the 1950s. Would you have suffered through the 10%+ drops marked on the chart? Granted…it was a pretty tame decade!
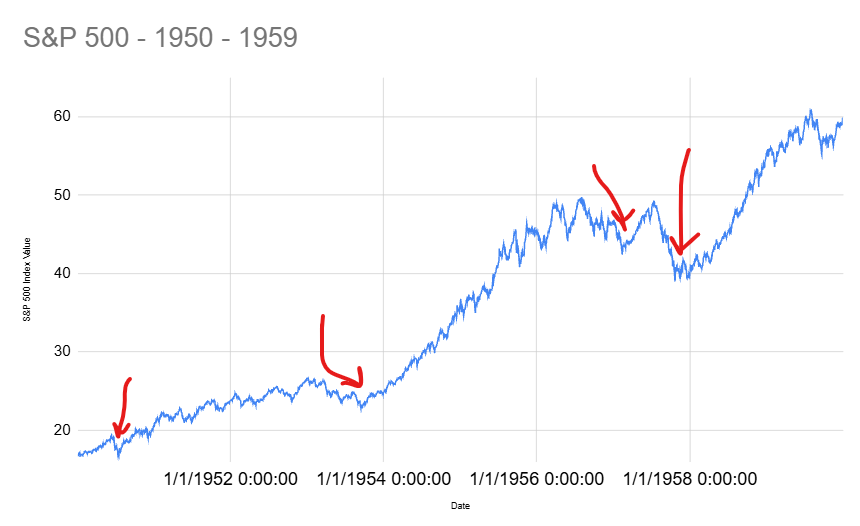
Any successful long-term investor over the past 100+ years suffered through similar market behavior.
I know it’s not fun to watch your portfolio fall. But trust that this is a normal part of the process.
Thank you for reading! Here are three quick notes for you:
First – If you enjoyed this article, join 1000’s of subscribers who read Jesse’s free weekly email, where he send you links to the smartest financial content I find online every week. 100% free, unsubscribe anytime.
Second – Jesse’s podcast “Personal Finance for Long-Term Investors” has grown ~10x over the past couple years, now helping ~20,000 people per month. Tune in and check it out.
Last – Jesse works full-time for a fiduciary wealth management firm in Upstate NY. Jesse and his colleagues help families solve the expensive problems he writes and podcasts about. Schedule a free call with Jesse to see if you’re a good fit for his practice.
We’ll talk to you soon!
This is a great analysis of how the market has worked for many, many years. The graphs tell the story of declines and increases, and very ably illustrate why investors need to stay the course with the stock market!
Thank you. This was well timed. I myself hold some semiconductor stocks, and boy, the ups and downs on that ride. Of course, I could still be down while the market goes up; that’s what happens when you take extra concentrated risk positions. Good thing for me, it is not a big position.
Always nice to see these reminders when a lot of investors hit panic mode.