In 2007, author Philip K. Dick became the first science fiction writer included in the illustrious Library of America book series. Have you heard of him?
Perhaps you’ve heard of:
- Total Recall (1990 & 2012)
- Minority Report (2002)
- Blade Runner (1982)
- A Scanner Darkly (2006)
- The Adjustment Bureau (2011)
- The Man in the High Castle (2015)

Each of those movies and shows is an adaptation of Dick’s work. And his novel Ubik was listed by Time magazine as one of the 100 greatest English-language novels.
Suffice to say, Philip K. Dick is one of the preeminent 20th-century writers. He’s a cultural influence. He’s famous.
But Dick died in 1982, before the movies and shows and national recognition. He earned a few small sci-fi accolades while he lived, but nothing more. His eventual fame was completely unknown to him. He spent most of his life as an impoverished writer who abused drugs to pass the time.
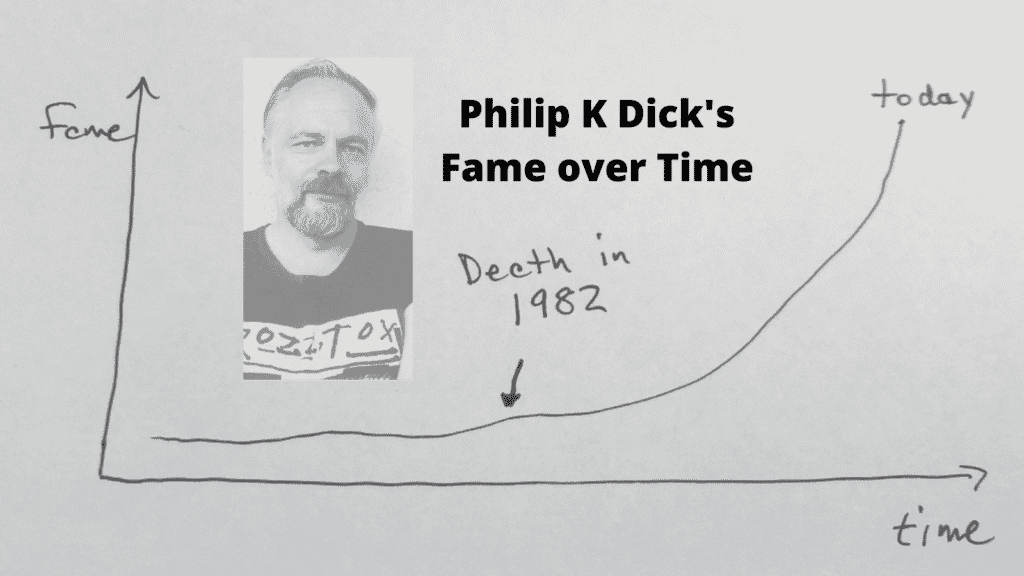
Dick’s fame had a different timeline than his life. It’s an eye-opening example of path dependence.
We can zoom out and convince ourselves that all is well. The excellent writer found his fame. The cream rose to the top.
…eventually.
But when we zoom in, we realize that the specific path to Dick’s fame did him no favors. It all came too late. The path to a result is as important as the result itself.
Path Dependence in Investing
The idea of path dependence is vitally important for investors—especially new investors. But it’s rarely covered by introductory financial education.
For example, the typical financial advisor or social media finance “influencer” will use a 7% annual inflation-adjusted return to describe stock market expectations. Invest in stocks and you’ll get 7% per year. It’s that easy. After all, we have 100+ years of U.S. stock market history and inflation data to lean on. Zoom out and it’s clear.
But those experts don’t tell you about the path-dependent results. You need to zoom in to see them.
But Jesse…you always tell us to zoom out. Now you want me to zoom in?
We observe the past in years and decades. But we experience the present in hours and days and weeks. Life is zoomed in.
To be a good investor, you need to understand both sides of that coin. You need to know how investing works on both a short- and long-term basis. And when the short-term is choppy and bad, it’s challenging to be optimistic about a supposedly positive long-term future.
The intelligent investor accepts that challenge.
Here’s an amazing example of path dependence for a long-term investor.
Sally’s Bumpy Ride
Let’s look at Sally, who started investing money in the S&P 500 in 1991.

By 1995, she had achieved 4 years of returns at 12% per year. Nice!
By 1999, she had achieved 8 years of returns at 17% per year. Whoa! Could you blame Sally for thinking her investing ride was particularly blessed? A proverbial rocket ship?
But then the Dot Com Bubble burst. By 2003, Sally’s portfolio had fallen back to Earth. She’d been invested for 12 years at point, but the crash dropped her average return to 8% per year.
And then even more bad news. The Great Financial Crisis occurred in ’07 and ’08, and by 2009, Sally’s portfolio had achieved 18 years of 3.5% annual returns. That’s terrible. It had been two decades for Sally and her portfolio was at half the annualized return that was “promised.” The path dependency here must have felt terrible.
Of course, if Sally had stayed invested (and this is an all-important if), the 2010s bull market made her whole. By 2021, Sally would have seen a full 30 years of investing and achieved an 8% annual return. The plot below shows Sally’s annualized returns as she experienced them over time.
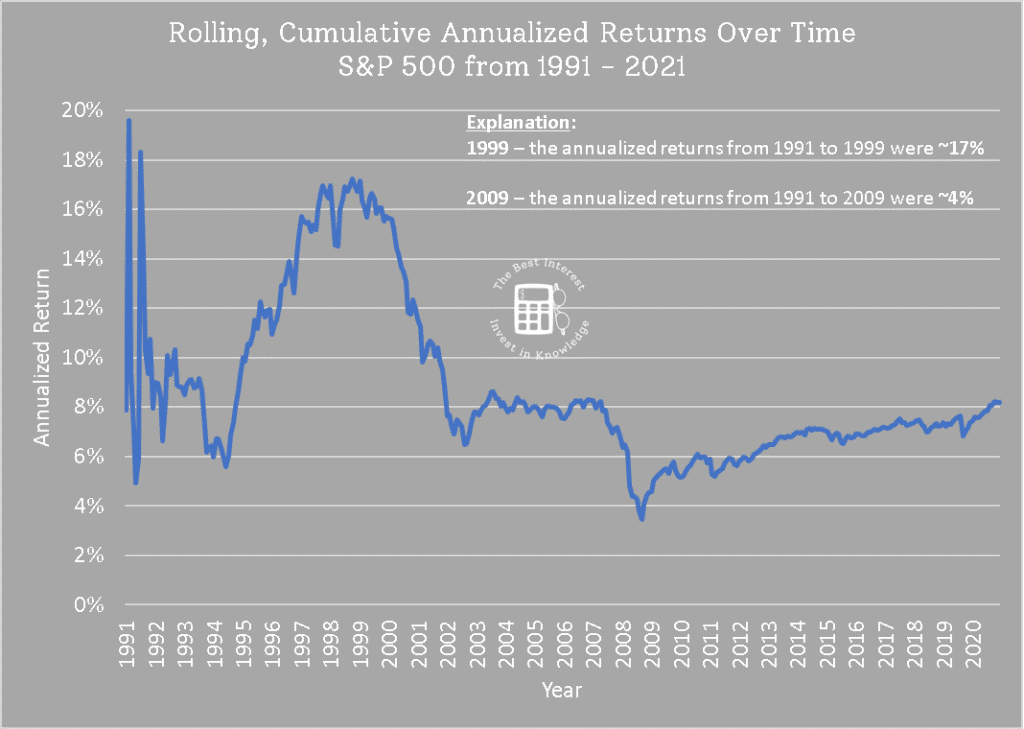
The question isn’t, “Did Sally achieve her expected returns?”
She did.
The question is, “How did path dependency make Sally feel along the way?” And to that end, was Sally able to stay the course during the worst times?
In the depths of 2008, was Sally consoled by the promise of a 7% average? I doubt it. Just like Philip K. Dick’s eventual fame was unknown to him, Sally’s eventual 30-year performance was unknown to her. She couldn’t “zoom out” and see her bright future. The future was a dense fog. All she knew was that her one-and-only investing path was severely underperforming expectations, and that her retirement was in jeopardy. Looks like it’s a few more years at NASA…
This is the curse of path-dependent investing. It’s directly correlated to the risks that you take. More risk, more path dependency.
We can re-run Sally’s experiment for other 30-year periods.
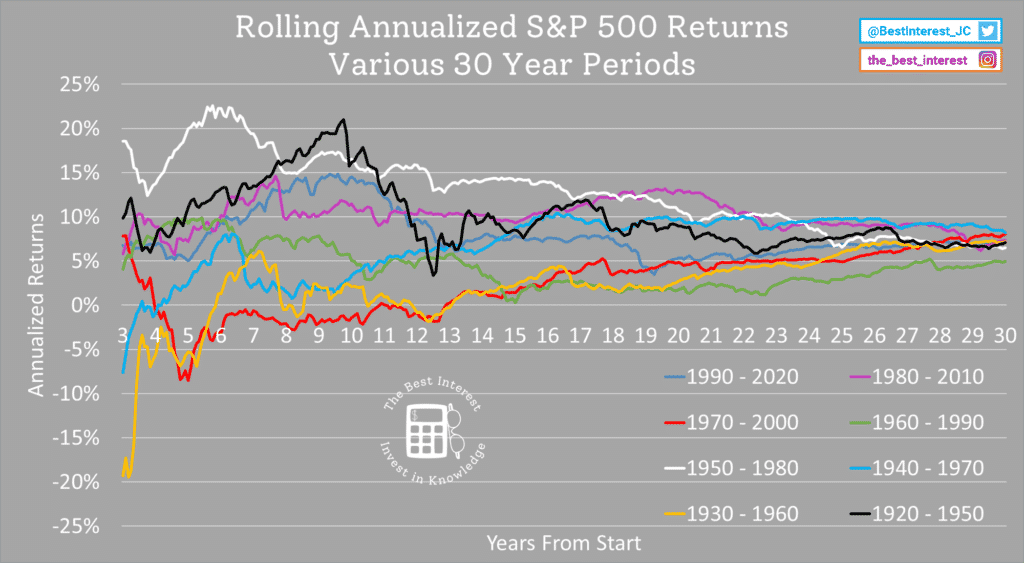
Some periods start hot and end cold. Vice versa for others. They all converge between 5-8% per year after 30 years. You could argue the purple line, 1980-2010, is close to a “steady” performance over the entire 30 years. But the rest are path-dependent and bumpy.
Check out the spread at 5, 10, and 15 years. “Just wait, you 1970 investor on the red line. Your 12+ years of negative real performance will soon turn the corner. I know it’s been a decade of losses…just stay the course!”
Long-term investors are almost always affected by path dependence as their portfolios grow. And path dependence strikes after we’re done investing, too.
During portfolio withdrawals (i.e. during retirement), the sequence of returns risk is another type of path dependency. Poor market performance early in retirement can inflict a mortal wound on a retirement nest egg.
Except unlike Sally, the typical retiree doesn’t have the option of “waiting it out.” They need to continue withdrawing money even when it’s disadvantageous to do so. That’s why sequence of returns issues can be irrecoverable in many cases. Scary stuff.
No Such Thing As Average
I’d argue there’s no such thing as a “7% per year” average in the stock market. Path dependency makes the average a false promise. We’d be much better off saying,
After 30 years, you’ll probably see somewhere between 500% to 800% total inflation-adjusted return. Any shorter period, all bets are off. And by the way, past returns don’t promise future outcomes.
I don’t mean to put down the people who use a 7% average. I’ve used it here on The Best Interest! It’s a convenient shorthand that makes our job easier.
But it leads unsuspecting new investors to expect guaranteed returns over short timespans. Those faulty expectations lead to disappointing outcomes. And disappointing outcomes can hurt feelings, hurt friendships, and ultimately, hurt someone’s finances.
If you want a guaranteed return, buy a high-grade bond. “Guarantee,” of course, means “low risk.” And lower risks aren’t as fruitfully rewarded.
Read more: Risk and Reward
For anyone who wants higher returns, stop thinking about annual averages. Erase it from your mind. It’s misleading. Perhaps consider a decadal or bi-decadal average. But not an annual one.
This article would be incomplete without mention of the one “free lunch” in investing: diversification. A diversified portfolio suffers path dependency too, but on a smoother basis. In investing parlance, this is because “risk-adjusted reward” is maximized by diversification.
And a smoother ride is easier to stay on.
The End of the Path
Path dependency is real, not science fiction. Just ask Philip K. Dick.
But it’s often ignored, and that ends up hurting the most vulnerable members of the investing community: small, young, inexperienced retail investors. It’s not a good outcome.
Hopefully, this article reminded you that “an investment in knowledge pays the best interest.” Stay the course and enjoy the ride, especially when it’s bumpy.
Thank you for reading! If you enjoyed this article, join 8000+ subscribers who read my 2-minute weekly email, where I send you links to the smartest financial content I find online every week.
-Jesse
Want to learn more about The Best Interest’s back story? Read here.
Looking for a great personal finance book, podcast, or other recommendation? Check out my favorites.
Was this post worth sharing? Click the buttons below to share!
Hey, it is why math is important to in real life. A chemical engineer like me with three levels of calculus in college followed by some real hard math never worries about the short term volatility. Because it’s just math.
Hey Steve! You’re right. Tho sometimes the “short-term” volatility lasts over a decade 🙂 Yikes!
One key piece of information in your post I would like to point out is your example of holding the S&P 500 index. Holding a “self-cleaning” index fund (companies are removed from the index and added without the investor having to do anything) is an advantage over holding individual stocks. If Sally held individual stocks the results could be a lot different unless she knew when to buy and sell them. I know from my own painful investing experience watching big successful companies go to zero while holding them for the long-term. In the 2000’s it was some of the .com companies, but also large tech companies that I thought couldn’t fail (Nortel). In 2009 my long term holdings in GM went to zero. A company that had been around for decades and funny enough is still around! However, GM stock stopped trading on the New York Stock Exchange on June 1, 2009, the day that GM filed for bankruptcy. This wiped out all common shareholders me included. These were painful lessons that lead me to become an index investor. Experience has proven to me that I can’t time the market, or know which companies to buy or when to sell. Investing in an index like the S&P 500 having a optimistic long-term hold strategy seems to be the magic long-term solution for me. Something I wish, I knew when I started out investing.
Excellent addition, Tech.
The indices most frequently add companies before their apex, and drop companies before they fall to zero. And this absolutely benefits the average retail investor.